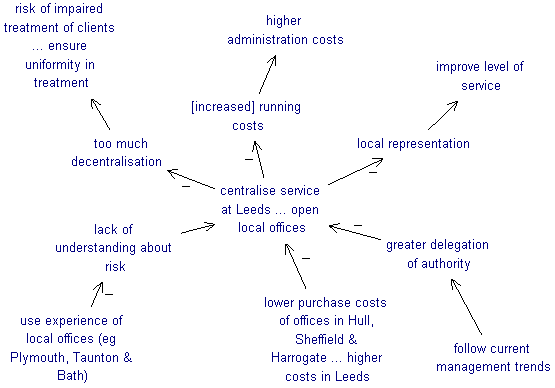
An example of a cognitive map

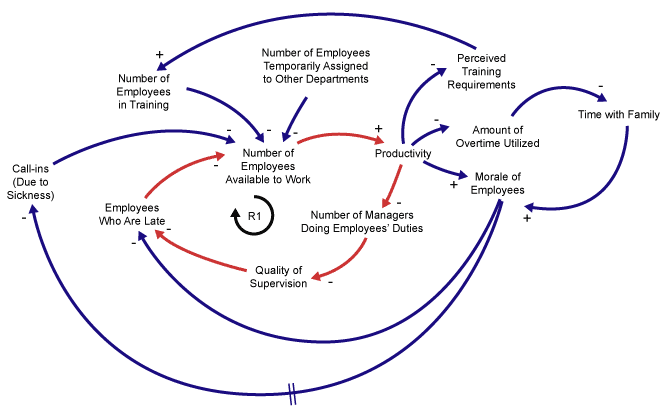
An example of a causal-loop diagram

Cognitive maps and causal-loop diagrams may appear very similar, however there are subtle differences. The significance of these differences can affect the strategies adopted.
- Cognitive mapping focuses on the thinker, whereas causal-loop diagrams focuses on the situation.
- Causal-loop diagrams attempts to model actual causal interconnections within a situation. Cognitive maps attempts to represent peoples perceptions and feelings.
- Causal-loop diagrams attempts to answer what is happening, whereas Cognitive mapping focus more on how the perceivers feel about what is happening (sometimes human perceptions of reality are more important that reality itself).
- Causal-loop diagrams are often created by an individual. Cognitive mapping requires the perspectives of many.
Sometimes being able to accurate construct a dynamic model of a system is not enough. A good example of this is the 5-a-day campaign. This is a common national campaign in many countries that encourages people to eat at least 5 portions of fruit and veg per day. This recommendation originated from the World Health Organisation, which suggested everyone should be consuming at least 400g of fruit or veg per day. The human body is a very refined system and consequently scientist and academics have been able to map this system using causal-loop diagram techniques. However, these techniques would reveal that the human biological system demands more than 400g. In fact some studies show that doubling the daily consumption of fruit and veg (to 800g) significantly increases protection against ALL forms of mortality. The problem is that everybody views the world differently, and have developed different perspectives on life and different beliefs on what they value most. It seems national governments tend to understand this phenomenon well. In many Western countries the average consumption of fruit and veg is 3 portions. Expecting society to increase their portion intake to 10 pieces would have been an unrealistic expectation. Campaigning for 5 portions (and average increase of 2) is viewed more realistic and consequently effective. Causal-loop diagramming would not have necessarily revealed this strategy however, cognitive mapping would have certainty uncovered the complexity of this problem much better. A rigorous and thorough cognitive mapping exercise would likely reveal the extent people value the necessity to each fruit and veg.
A final point...
Some messy problems simply have no clear, calculable solution. Logical approaches do not necessarily help in these situations. Anyone who may have tried using causal-loop diagram to model such instances will quickly discover how complexity is so hard to map accurately. Therefore intuition comes to the rescue. Cognitive maps can better model a group's opinion, perspectives and feelings in situations where no factual solutions are not available.
