OU blog

Personal Blogs

New photo

Thinking of the future: Activity 26 Block 4

Visible to anyone in the world

Thinking of the future: Activity 26 Block 4

Easter image in Crete: A girl looks in a window

DREAM (photos thanks to Loukianos – my artist-friend):

In this glass, I see myself and lots of objects that represent the future people predict for me: tonight’s festival in the streets of Aghios Nikalaos – the first of many, and unending and ambiguous adherence to orthodoxy, religion, a husband or my own kind of renewal: new life.

Wheat I see in learning analytics has to offer me not certainties but choices, not prescribe for me but prompt for me, understand me when I chose another way and offer more choices on that path

Urban scene

NIGHTMARE

They write all around me, I can’t read it. I’m not sure they want me to.

A singer in Crete

FAIRY-DUST

Here on a hill somewhere in Greece, the Sirens sing! Don’t look up to them – you’ll escape the text I put you in!

All the best

Steve

Permalink Add your comment
Share post
New photo

Deploying a vision of learning analytics: Activity 23 Block 4

Visible to anyone in the world

Deploying a vision of learning analytics: Activity 23 Block 4

·         Read about two implementations and make notes on how the visions that underpinned these impacted on the implementation of learning analytics. You may find that the vision is not clearly defined. If this is the case, state it as clearly as you can, based on the information that you have.

The 2 chosen implementations are:

·         Case Study 1A: The Open University Data Wranglers (Ferguson et. al. 2015:131ff.)

·         Cluster 2 – Australia (Colvin et.al. 2015:19ff)

The 2 publications have a totally different function and whereas Ferguson et. al. attempt to relate the efficacy of implementation strategy to ROMA, Colvin et. al. (in this general section) are much more interested in the concept of vision as a progenitor and /or emergent product of a project. Indeed, it is difficult not to see Cluster 2 as a representation of a ‘model’ form of LA implementation with Cluster 1 as its inadequate side-kick and foil.

Case Study 1A

As the first iteration of ROMA proceeded the goals of the project became (Steps 3 & 5) concerned with curriculum development and quality enhancement. Though apparently specified goals they have a very high level of generality and appeared to give report writers very little guidance (Step 7) about the expectations anyone had in particular about the function of this implementation. This may suggest an absence of vision, as does the statement:

There was no integrated, systematic view being developed to inform and enhance teaching and learning practice.

The general drive appears to be based on a supposition that a lot of unused data existed and that it might be a good idea to find out whether there was value in that data. The whole thing feels ‘data-driven’ therefore rather than driven by pedagogic purposes, other than a vague feeling that we could probably do this better.

This feels apparent in the name ‘Data-Wrangler’ given to operatives and to the fact that the motivation appears to have been driven entirely from a ‘technical context’ (the university’s ICT department).

It is unfair to expect an elaborate vision guiding pioneer studies and it certainly appears that later iterations of ROMA have enabled the Project to begin to bring together a vision it might originally have lacked – based in agreements between senior faculty managers and the Data-wranglers about the kind of reporting tools that might help them and in what timing schedule (p. 133).

The implicit learning in this Project, and perhaps standing as an emergent vision itself that justifies the endeavour post-hoc is the university learned that data might be useful in guiding the university’s pedagogy but not until the technical context was more thoroughly engaged with ecology of pedagogical practices throughout the university in Step 6.

Cluster 2

Although Colvin et.al, (2015:19) carefully confine themselves to describing ‘differences’ between the 2 Clusters in terms of three variables: concept, readiness & implementation, it is difficult not to see between the lines a perception that, relative to Cluster 2, Cluster 1 was deficient in all 3. I read these pages as a comparison between a model of a potential VISION for data analytic introduction and a deficit model.

It is not a bad start to see vision as a means of balancing variables like CONCEPT, READINESS & IMPLEMENTATION since they can easily equate with, or at least parallel, other ‘holy’ intellectual and research-based trinities like THEORY, REFLECTION & ACTION.

Whereas Cluster 1 appears to have started with a vague sense that that administrative ‘efficiency’ (‘reporting no or nascent strategy development’) could be improved by LA, this ‘vision’ was insufficient to bring together significant alliances or create or deploy leaders from its senior echelons. The opposite was true (it is claimed) of Cluster 2, where ‘efficiency was typically not mentioned by Cluster 2 institutions as a driver for LA’.

Although not stated as a conclusion supported by inferential statistics, vision is, it appears, very highly perceptible in alliances of stakeholders – especially pedagogic and technical: ‘in essence, communication, human resource and development processes and systems were in place for the commencement of implementation initiatives (p.20).’

Colvin, C., Rogers, T., Wade, A., Dawson, S., Gasevic, D., Buckingham Shum, S., Nelson, K., Alexander, S., Lockyer, L., Kennedy, G., Corri, L. and Fisher, J. (2015), Student Retention and Learning Analytics: A Snapshot of Australian Practices and a Framework for Advancement: Final Report 2016, Australian Government: Office for Learning and Teaching; also available online at http://he-analytics.com/ (accessed 15 June 2016).


Ferguson, R., Macfadyen, L.P., Clow, D., Tynan, B., Alexander, S., and Dawson, S. (2015) ‘Setting learning analytics in context: overcoming the barriers to large-scale adoption’, Journal of Learning Analytics, vol. 1, no. 3, pp. 120–44; also available online at http://oro.open.ac.uk/42115/ (accessed 15 June 2016).


Permalink Add your comment
Share post
New photo

The ‘Vision’ thing in Learning Analytics: Activity 22 Block 4

Visible to anyone in the world
Edited by Steve Bamlett, Thursday, 16 Jun 2016, 16:55

The task requires you to consult Table 4 from Dyckhoff et. al, (2013:226). Here is a Powerpoint version:

·         In a blog post, or in your learning journal, combine or develop some of these goals to construct a vision of what learning analytics could be at your institution or at one you know well. Aim for a vision statement that is no longer than two sentences.

·         Once you have constructed a vision, note whether it seems to be a learner’s vision, an educator’s vision, a manager’s vision or a combination of these. How would it need to change, if at all, to inspire other stakeholder groups?

It is not JUST that some of the goals here are ‘mundane’ that stops them being ‘visionary’ for me but that they fundamentally fly in the face of what I believe:

1.    learning to be, and;

2.    the function of an ethical and value-driven pedagogy.

For instance, let’s take the axiom ‘learners are supposed to compare own behaviour with the whole group / high performing students’.

For me, any learning that derives primarily or only from such a process is likely to be, if anything, a step towards an act of learning rather than learning itself. Learning that emerges from social comparison is, of course, a kind of learning – the kind of imitative achievement that Koko the gorilla was adept in – but, in its most serious articulation (Bandura’s notion of ‘modelling’) it is a complex beginning of a learning process based on many more social, psychological and bodily feedback processes than are comprehended in the initial act of imitation itself. This is why, I believe, Laurillard’s (2012) model of pedagogic process has to form so complex a visualisation.  

Let’s put that aside however and begin to envision. I’ve studied Table 4 carefully and come up with a visual representation below. It shows a ‘learner’s, teacher’s and administrator’s vision (of course grossly stereotyped – but I don’t know another way of doing this task - of the potential of LA. Together they form a picture of a vertical process through which these 3 eyes might become one in a grand bricolage.

The process could either be TOP-DOWN, where the administrator’s vision and needs dominate, initiate adoption of LA and offer it downwards. This is very like what is described in Cluster 1 of the Australian Universities studied in Colvin et. al. (2015:19ff).

Or it could be BOTTOM-UP, initiated by learner needs and aspirations. For me this is preferable and is imagined in PEAR.

More probable is initiation from pedagogy and involved both learners and administrators, creating end-goals for each, not all of which formed part of the original vision.

Overall, the aim is to see VISION as problematic as a front-loaded initiator of change that precedes any consultation between stakeholders.


So that’s all for now.

All the best

Steve

Colvin, C., Rogers, T., Wade, A., Dawson, S., Gasevic, D., Buckingham Shum, S., Nelson, K., Alexander, S., Lockyer, L., Kennedy, G., Corri, L. and Fisher, J. (2015), Student Retention and Learning Analytics: A Snapshot of Australian Practices and a Framework for Advancement: Final Report 2016, Australian Government: Office for Learning and Teaching; also available online at http://he-analytics.com/ (accessed 15 June 2016).

Dyckhoff, A.L., Lukarov, V., Muslim, A., Chatti, M.A. & Schroeder, U. (2013) ‘Supporting Action Research with Analytics’ in Proceedings of the 3rd International Conference on Learning Analytics and Knowledge (LAK’13) 220 – 229.

Laurillard, D. (2012) Teaching as a Design Science:Building Pedagogical Patterns for Learning & Technology New York, Routledge,


Permalink Add your comment
Share post
New photo

Ethical Action in Learning Analytics: Activity 20-21 Block 4

Visible to anyone in the world
Edited by Steve Bamlett, Wednesday, 15 Jun 2016, 21:41

Is collecting data about my 'own' learning without my knowledge by someone else ethical? If so, to what extent in relation to both the quality and quantity of data thus collected? This is a problem in data analytics because so often data can be collected without intention to use and / or store it, especially in a digital age. Once collected unintentionally, value can be perceived in it after the event? Does this raise moral obligation then in the owner of that information to declare that it is being used for reporting purposes, stored, and analysed / interpreted?

Once analysed and interpreted secondary data, that might also be considered to be about the person, is formed but to whom does this data belong? And who is responsible for its validity and reliability?

I was delighted that all of those issues were considered by the Student representatives reported on in Slade & Prinsloo (2014) and even more to see the evidence that this consultation found its way, in an intelligent and principled manner, into the Policy on Learning Analytics Ethics.

Tasked now with producing a shorter and more linguistically accessible for students, I feel out of my comfort zone and perhaps my depth. But one point needs making before I try.

In the instructions to Activity 21 I read;

Can you make your summary interesting enough and short enough to feel confident that students would be likely to read it?’

Next to that comment I want to place a point from the policy itself:

            We should guard against stereotyping. (From 4.2.1).

What is it in academic institutions that they need to assume that students potentially possess per se a limited attention span and a need to be stimulated by additional elements in a text than its what is there? This is in itself stereotyping.

The prejudice to brevity in writing in particular does not, I believe, derive from learners but from a peculiar turn in thought about discourse in public life made after the mid twentieth century and that gathered pace in the digital revolution as an increasing stress on brevity (of text, paragraph, sentence) and even the conceptual demands we  make on each other. Twitter tells you off and asks you to be ‘more clever’ if you go over its word limit. It is sometimes justified by reference to democracy and the working class, to which I say: ‘we should guard against stereotyping.’

The same assumption that drives the Activity instructions also doubts whether it is appropriate to ask young people now to read Milton. Thankfully some areas of life and academic endeavour still guard against stereotyping. Working people in E.P. Thompson’s History of the English working Class knew Milton ‘by heart’.

But that is by the by. What I wanted to say is thank you, OU for this wonderful policy and for the transparent brilliance of the process of its formation.

Sometimes policy and procedure appears merely as paper to prove some process occurred – allowing the really dirty unethical nature of some practices to remain in situ. The institution can at least say; ‘But look we have a policy’. This policy does not seem like that.

But I don’t think I have to simplify it for other students, Instead I want to celebrate one lovely complex sentence with an even more complex meaning. This sentence is linguistically and semantically complex because it has to be. So are the processes in life that necessitate it being said. It is:

Principle 3: Students should not be wholly defined by their visible data or our interpretation of that data.

That principle catches a danger in principle 2 that the OU asserts its right and duty to use 'meaning' it extracts from student data; that is it or its employee’s interpretations of data. Principle 3 makes it clear that nothing in that or the primary data from which it derives can be used as a means of summarising comprehensively any person who becomes a learner in the OU.

This necessitates Principle 6 – about the necessity (‘should be’) - of engaging and involving learners in every aspect of the use of data. Good old OU. I knew you would not fail us in the end.

I hope I’ve said enough to wriggle out of doing as I’m told – never a comfortable thing for me at any time.

All the best

Steve

Slade, S. & Prinsloo, P. (2014) ‘Student Perspectives on the use of their data: between intrusion, surveillance and care’ in Challenges for Research into open & Distance Learning: Doing Things Better – doing better Things Oxford, EDENRW8 Conference Proceedings 291 - 300.


Permalink Add your comment
Share post
New photo

Mapping problems to the ROMA cycle: Activity 19 Block 4 Ferguson et. al. (2015).

Visible to anyone in the world

ROMA

I’m not, at this stage, ready to do a presentation on this. A presentation done by a group representing key stakeholders would hold more sway. 

ROMA Stage

Problems

Map political context

·         International and national concern about data privacy

·         Ideology and politics of retrenchment regarding human and other resources

·         Switch from government to sustainable self-gathered funding and revenue resources

Identify key stakeholders

·         Personal identity of key stakeholders can feel to be (to themselves and others) locked into the practices seen as appropriate in only one of the sub-communities.

·         Relative power of professional and non-professional human resources, including the role if trades unions, of communities involved

·         Resistance to changes in relative status & control between communities

Identify key desired behaviour changes

·         Standardised procedures for data collection and interpretation

·         Commonality between academic departments on a range of pedagogic matters.

·         More interaction between communities to achieve common goal

·         Move away from a culture that separates knowledge, values and skills in technology from pedagogical knowledge, values & skills

Develop engagement strategy

·         Communities do not mix – elements of material, intellectual & emotional culture are separate (separated venues for community identification, sub-cultural markers are powerful and have attributed status)

·         Policy statements are not known across different communities.

·         Communities do not meet.

Analyse internal Capacity to change

·         Fear of intrusion or overt differences in power between groups (students& teachers. Teachers & admin, Teachers & managers)

·         Public compliance with policy and private resistance within communities and individuals

·         Lack of common mission

Establish Monitoring & learning framework

·         Ethical concerns

·         Fear of losing political advantage

 Some Reflections

  1.           i            The key issue is that the ROMA cycle is precisely that – an iterative process. Hence dependencies between problems at different stages (of which they are many) get incrementally and serially addressed across each cycle. This probably helps to speed up change process if a virtuous cycle can be achieved.
  2.         ii            The issue of building trust between individuals and communities lies at the root of this problem. The link of personal identity to the values of a community can help maintain its desire for separateness.
  3.       iii            Intrusion can be resisted by lying and unconscious neglect as well as straightforward overt resistance.

All I can do for now.

All the best

Steve

Ferguson, R., Macfadyen, L.P., Clow, D., Tynan, B., Alexander, S. and Dawson, S. (2015) ‘Setting learning analytics in context: overcoming the barriers to large-scale adoption’, Journal of Learning Analytics, vol. 1, no. 3, pp. 120–44; also available online at http://oro.open.ac.uk/ 42115/[Tip: hold Ctrl and click a link to open it in a new tab. (Hide tip)] (accessed 15 June  2016).

Scanlon, E., Sharples, M., Fenton-O’Creevy, M., Fleck, J., Cooban, C., Ferguson, R., Cross, S. and Waterhouse, P. (2013) ‘Beyond Prototypes: Enabling Innovation in Technology-Enhanced Learning’ Technology-Enhanced Learning Research Programme; also available at http://beyondprototypes.com/ (accessed 15 June 2016).

Permalink Add your comment
Share post
New photo

The case for a Bricolage Action Research Approach: Activity 18 Block 4 Scanlon et. al. (2013).

Visible to anyone in the world
Edited by Steve Bamlett, Wednesday, 15 Jun 2016, 15:27

TEL ComplexThis is Fig.1 from Scanlon et. al. (2013:29)

 Coketown University Report.

Introduction.

The long-term goal of senior managers at Coketown is to ensure that it can state and provide evidence that ‘learning and teaching at this institution are supported by learning analytics (LA)’. It equates this aim with a vision for the development of LA that can be carried forward into future goals, even ones as yet unknown. This is visionary because LA does not only aim to support teaching and learning but to uncover data that enables its transformation moving forward. This is why Fig 1 above has VISION at its centre.

This report, without denying the value in potential of that vision will argue that no single and unitary process of holistic change is likely to be possible, and that the immediate aim should be to state that ‘learning and teaching at Coketown University is being currently transformed by an active and ongoing process that will aim to build its future with the fullest support of LA. That process of transformation is shared and ‘owned’ by the university’s staff, learners, partners and funders ensuring that change occurs within a sustainable and stable framework.’

The problems raised by change

Even when senior managers express a vision with conviction, integrity and in the best interests of all stakeholders in the pedagogic enterprise, they have to face the realities posed by change, especially in an institution with the history and well-earned pride as Coketown.

That reality can be expressed in terms of seeing the core elements of the practices which support vision in terms of the strong communities which engage these practices and a long history of having successfully done so, We can (as in Fig. 1), express the university’s practices under 3 headings of practice necessitated by maintain and sustaining the university over time:

1.    Policy creation, update  and revision

2.    Management of the Environment (including a wide range of resources from buildings, open or dedicated spaces and core equipment).

3.    The generation and maintenance of revenue in terms of the relationship between the university’s income and expenditure, including non-returnable funding from partners in government, business & the 3rd sector (I have chosen not to make these appear two headings as might be suggested in Fig. 1).

Under this mantle exist 4 communities of variable distinctness. Some of the changes we envisaged involve working with current best practice of successful and evidence-based interactions between these communities and supporting their semi-independent growth outwith the constrictions of a single vision.

These elements of co-produced change will form the patches of the bricolage which will build to our ultimate vision.

At base these communities are those based in pedagogical and technological practice.

1.    Pedagogical communities with different traditions and structures (and sometimes apparently different goals) include:

1.1.  The Student Community, with a clear stake in successfully applied pedagogical practice, which we have found to be best supported by involvement in those practices.

1.2.  The Teacher Community, sometimes divided into subject-discipline departments with different traditions but a common aim. Our aim is to build on that commonality.

1.3.  The Pedagogical Resource Community, including administrators, rooming, catering as well as educational equipment. And;

2.    The Technical Communities, often apparently operating in (what appears to others) an impenetrable world of technological knowledge, skill and linguistic exchanges. Thus while we often speak of an ‘ecology of practices uniting the pedagogical community, the context of technology is in practice often seen as remote from those practices – a fact revealed in Macfayden & Dawson’s (2012:157) finding that in one sister university 70% of teaching staff made no use of the university’s LMS.

Clearly one major aim is to bring the technical context within the embrace of the ecology of practices that currently sustain community alliances in Pedagogical matters. This is easier envisioned than brought about and we see change as occurring piecemeal (or so it might appear) but under the aegis of a persistent intent to turn co-construction of new practices (and the community alliances involved) under one umbrella.

In the mean-time, though our umbrella may look to the aspirant like a leaky patchwork, we endeavour to achieve stability in stages (often uneven stages, of discrete development overseen by senior managers. This is the process Scanlon et. al. (2013:33) call ‘bricolage’. When ‘vision’ appears to everyone except senior managers as a potential imposed ‘nightmare; we agree with Scanlon et. al (2013:33) that:

Vision often emerges and evolves through exploration, through networking and through active engagement in research, development and educational practice.

RECOMMENDATION

Hence our recommendation that policy and advertising material bear the statement:

‘Learning and teaching at Coketown University is being currently transformed by an active and ongoing process that will aim to build its future with the fullest support of LA.

That process of transformation is shared and ‘owned’ by the university’s staff, learners, partners and funders ensuring that change occurs within a sustainable and stable framework.’

One example from our current ‘bricoleur’ activity is the Life-Long Learning Advisory Project, PEAR.

All I can do for now.

All the best

Steve

Macfayden, L.P. and Dawson, S. (2012) ‘Numbers are not Enough. Why Learning Analytics Failed to Inform an Institutional Strategic Plan’ in International Technology & Society, 15 (3), 149 – 163.

Scanlon, E., Sharples, M., Fenton-O’Creevy, M., Fleck, J., Cooban, C., Ferguson, R., Cross, S. and Waterhouse, P. (2013) Beyond Prototypes: Enabling Innovation in Technology-Enhanced Learning. Technology-Enhanced Learning Research Programme; also available at http://beyondprototypes.com/ (accessed 15 June 2016).

Permalink 1 comment (latest comment by Melanie Hainke, Tuesday, 26 Jul 2016, 19:37)
Share post
New photo

Using ‘numbers’ to construct persuasive conditions / arguments for Change Activity 17 Block 4 Macfayden & Dawson (2012)

Visible to anyone in the world
Edited by Steve Bamlett, Wednesday, 15 Jun 2016, 12:57

Reframe the reasons given in this paper for poor uptake of LA?

The situation described in this paper is a case study of how and why a substantive case for action to produce change can be constructed from the numbers yielded in LA, institutions RESIST such change both at the level of actions taken by aggregations of individual members of the institution and institutional processes.

The authors frame the reasons for the resulting stasis using two category heads:

·         Perceived attributes of an innovation – in which they argue that that it is how the change is perceived that blocks change. They use this to argue that innovation is often misrepresented conceptually at the level of reception of the idea, using formulation of a concept of ‘cognitive evaluation’ in Rogers’ (1995) theory of the diffusion of innovation.

·         The realities of university culture. Here they widen and deepen the issue of ‘resistance’ to include effects at the socio-cultural (and organisational) level of the university’s style of governance. The case is that universities are structurally and functionally biased to innovation because of a governance culture rooted in ‘agrarian’ modes of institutional governance (wherein nodes of consensual governance over discrete areas of operation – subject discipline faculties – control the university’s key functions of teaching and research). Why these are labelled agrarian defeats me but let’s leave that. Universities, it says are culturally built to resist the model of corporate management - hierarchical and top-down that represent innovative ‘industrial’ innovation.

These reasons clearly represent innovation as bound to cognitive misrepresentation at a number of levels (understanding and application for instance) and pre-determined to fail by cultural issues  that must resist if an older culture of governance is to survive the genuine threat to it posed by innovation. This is ‘management-speak’ that characterise the notion of corporate business studies and which in the UK has already transformed (or is in the historical process of transforming) institutions like the nationalised industries, the NHS, secondary (and now primary) education and local government. And these reasons have it both ways:

1.    Our innovations are misrepresented as posing a threat or additional burden;

2.    Our innovations are a threat to a culture that is presupposed to need to change.

Needless to say, I see this paper as the representation of a fixed view that fetishizes change which I call the ‘corporate’ vision that the paper insists (p.161) is one of the misrepresentations of innovation it is fighting.  Yet despite the fact that the paper itself resists characterising the changes it desires as ‘market-driven’, its argument spring entirely from that quarter. In asking that we argue not just from numbers but conditions that appeal to the heart, they may appear to be presenting something new. It isn’t – this is the corporate vision of change by harnessing to it ‘evaluative conditioning’, the advertising innovations of the behaviourist, Watson. Let’s start then by registering that I believe this paper to represent a very entrenched ideological case for change that is no nearer to pedagogy, in its content, than the patrician system of oligarchical autonomous units it wants to replace.

We can’t change then without better arguments – one that speak to the hard and soft realities of pedagogical governance and without pre-conditioning the area we can to be receptive to change. That is good management. I will leave aside however, whether I believe it to favour pedagogical goals of substance in themselves.

 What I believe we do need from this paper is this:

1.    Clear understanding that quantitative evidence alone cannot carry an argument without specification of the qualitative data that represents the process of teaching and learning. Purely quantitative arguments (of whatever volume) are impoverished arguments.

2.    That a case based on merely technocratic reasons that fail to address the constitution of the identities of its audience in the very practices it seeks to overturn will not work. Arguments must also provide the emotional grounds for change – its potential, insecurities and emotionally sustaining fail-safes.

3.    We could call this respect for diversity – an element on which this paper is, explicitly at least and perhaps implicitly, bereft.

My reframing (p. 159ff):

No new Headings but one new preface:

We have both got it wrong!

Resistance (or reactance) is increased by top-down imposition (even if the content is presented as a ‘vision’ or ‘mission’.

Be honest about market pressures where they are a historical factor driving change, Contextualise them in pedagogic goals and don’t pretend they don’t exist.

People preserve their identity, rooted in older practices and structures, as a source of stability. The need for stability and its meaning needs to be engaged with in the argument and the ‘incentives’ for change – seeing value in greater fluidity, new sources of stability or reassurance are made available.

The innovation can sometimes be presented in simpler forms or (consider Laurillard here), its complexity embraced as part of an evolving set of practices which identify teachers and learners as co-agents in change practices.

Workload issues need to be at the forefront: what aspects of change will be time-consuming (these will be areas of novice trial and error practice). How resources will be allocated to these in the interim. The achieved and evidenced savings in personal narratives of successful pilot implementation.

Increase the stakeholders involved in representing change process – not just either corporate managers or ‘faculty heads’ but both of these (trained to listen and hear each other) AND students AND employers AND counsellors etc.…. This challenges myths, for instance, of ‘learner homogeneity’.

All I can do for now.

All the best

Steve

Macfayden, L.P. and Dawson, S. (2012) ‘Numbers are not Enough. Why Learning Analytics Failed to Inform an Institutional Strategic Plan’ in International Technology & Society, 15 (3), 149 – 163.

Permalink Add your comment
Share post
New photo

Socialised Learning Analytics (SLA) Activity 16 Block 4

Visible to anyone in the world
Edited by Steve Bamlett, Wednesday, 27 Jul 2016, 20:15

Which one of the forms of SLA in Ferguson & Buckingham-Shum (2012) would I recommend to my company (if I had one) to develop as a priority and why?

This paper (returning to it again) is what gives me hope in the course. Here is a ‘learning analytics’ I can relate to because:

  • ·         The functions it relate to are all necessary to good teaching and learning;
  • ·         They explicitly involve the learner as the central point of reflection and action on what we learn from the analytics. That teachers are also involved is good. It presupposes a collaborative interest in a joint goal (the learning the learner wants to achieve);
  • ·         The data here is finely grained and sensitive use of it appears to be intended. It is qualitative.

Faced with a choice, I might emphasise as a priority to my ‘company’, the development of the role (section 4.2 and 5.4) of ‘disposition analytics.’

This feels to me totally concordant with traditional teacher concerns with ‘autonomy’ and ‘self-regulation’ in learning that I associate with Carol Dweck. It is about the malleability and variability of motivational factors and can aim to address them through an interaction of internal personal and external environmental factors that often correlate with motivation in ways that good teachers have always done.

It is about the reliance of pedagogies on being ‘open to new ideas’ and about ‘life-long learning’. The visualisations it achieves belong primarily to the learner to guide whatever interactions with environmental support they need or might be guided to. The choice can still be theirs.

It is likely that they will use teacher and peer support because the variables that make up motivation clearly include the role of others, in a ‘no wo(man) is an island’ kind of way. In 4.2 ‘relationships and interdependence’ are seen as being as primary in motivation as identity (5.4) and I genuinely believe that they are. 4.2 extends this into 3 valid points if I need them in an essay.

The macro-variable in the ‘Effective Lifelong Learning Inventory’; (ELLI) is ‘Learning Power’. My only concern here is the inevitable need to tie these issues to ‘power’ but still, that’s the age we’re in! The spider visuals show how. Here is Fig 3 from the paper. It is clearly an item of facilitated dialogue – in which technology is an enabler of pedagogy by being so good at producing clear visualisations of evidence that could automatically feed development. And the categories it uses matter, including the importance given to relationships. No one says anything here about ‘Critical curiosity’ but I think they should. As a category it aligns with the development of cognitive presence and a good teacher could easily make that important, linking it to other dispositional variables. It is so much better than anything that used to happen. No one category is prioritised (as I think all other LA to date as prioritised ‘Strategic Awareness’). At last, an education theory not designed as the co-production of avatars of Count Bismarck.

I just love it!

Ferguson, R. and Buckingham Shum, S. (2012) ‘Social learning analytics: five approaches’ in Proceedings 2nd International Conference on Learning Analytics and Knowledge (29 April – 2 May 2012), Vancouver, British Columbia, Canada, New York, ACM Press, pp. 23–33; also available online at http://oro.open.ac.uk/ 32910/ (accessed 14 June 2016).


Permalink Add your comment
Share post
New photo

Visualising Social Networks Activity 14 Block 4

Visible to anyone in the world
Edited by Steve Bamlett, Tuesday, 14 Jun 2016, 15:49

Part 1

Consider how the uses identified in Bakharia et. al.(2009:49) of SLN support teaching & learning (TL) and identify any problems.

What a SLN chart can do?

How used

Any problems

identify disconnected (at risk) students

These learners appear to be the ones who give tutors a ‘hard time’ because they ‘report high levels of dissatisfaction in course and teaching evaluations’ (Dawson et. 2010:131). This is a very convenient method of alert to this and will prompt action.

But what action? It feels to me that it is possible that it will appear to be the student who is ‘the problem’. Certainly the ethical issues of the singling out (and possible scapegoating process) are not discussed.

identify key information brokers within a class

Clearly if a learner node is ‘dominant’ in mediating and initiating interactions then this fact will be useful. However, how will the information be interpreted?

Again, this sounds like a means of prescribing group behaviour and adjusting individuals who do not fit in with that behaviour. I was horrified when this was done to me. I consider it highly unethical unless much more open to scrutiny and monitor. If the learners aren’t themselves centrally involved (which they should be – do not do it!).

identify potentially high and low performing students so teachers can better plan learning interventions

This has always been a goal of good pedagogy and enables differentiation of teaching method and content. Here it could help where the differences relate to high granularity issue – like comparative pace through course materials.

SNAPP as described does not give any way near enough information. Strength – number of interactions. Any teacher using that formula f2f would be rightly despised. Moreover, the information is not as finely grained as it would need to be to make these judgements. Some qualitative follow up would be needed to justify action.

indicate the extent to which a learning community is developing within a class

It shows patterns of interaction and that might identify democratic working and the problems ’associated with a central actor’ (Dawson et. al 2010:130) in disrupting community centrism.

This identification is based it would appear on research but it predicates a role for the teacher of group intervention that is difficult to think through ethically. Of more concern is that these writers don’t seem to want to consider the ethics of their certainties about what is good and bad interaction and its link to other pedagogic variables.

provide a “before and after” snapshot of the various interactions occurring pre and post learning interventions.

This seems to me an acceptable use provided learners know that is routine. I would confine its usefulness to description of the effects of different interventions for the sake of future planning of learning activities.

If this is used as a tool to identify ‘troublemakers’, it is full of problems – evident from what I say above.

provide timely opportunity for students to benchmark individual performance and engagement against fellow peers.

I am not sure that knowing where you are relative to ‘peers’ is really useful – although it certainly feeds the ideology of competitive individualism.

What are we trying to teach people? Be better than everyone else?


Part 2 Draw a SLN graph for a recent forum on H817 with at least 6 contributions. How does it help in understanding the group and my own role? Are there misleading elements in it?

I am disturbed to be asked to do this. I dropped out of Block 3 entirely because it involved agreeing to myself or another taking roles in group work that I consider oppressive and unnecessary. Certainly, for me they would be stressful ones – mainly about progress-chasing (called ‘managing’) the product’s co-production and observing and reporting back on other group members’ behaviour.

This exercise asks me to pick an interaction with colleagues and to report on my own and others’ behaviour. I am happy to reflect on my own behaviour in a safe space or in a space where it is my choice whether I expose myself to others. I will NOT observe others without asking their permission and initiating ethical safeguards because my social behaviour is largely guided by a principle I'd call 'regulative empathy' (which requires trust unlike monitoring) as the means by which groups gain enough confidence in each other sufficient for truly collaborative work. This exercise feels like another extension of the top-down corporate ideology that sustains this module.

However, I do see that the exercise could have a purpose for me. It would expose evidence of the lack of finesse in the observed categories of SLN (like the category ‘actor’ which disposes of invisible human functions like ‘passive listening’ at a stroke) and the distance between the evidence thus collected and the purposes it ought to serve (assisting groups and individuals to learn in ways they chose to learn). Moreover, it lacks any rounded sense of the complex beings that human learners are.

Psychologists, social workers and health researchers would not commit the gross infringements of confidentiality, informed consent and group integrity involved here. I have often thought that teaching should, like those professions, be a regulated one – bound by a code of conduct. Despite being resistant to that idea – this module has convinced me of its necessity.

Bakharia, A., Heathcote, E. & Dawson, S. (2009) ‘Social Networks adapting pedagogical practice: SNAPP’ in Proceedings Ascilite Auckland 2009: Poster Available from: http://www.ascilite.org/conferences/auckland09/pocs/bakharia-poster.pdf (Accessed 14/06/2016)

Dawson, S., Bakharia, A., & Heathcote, E. (2010) ‘SNAPP: Realising the affordances of real-time SNA within networked learning environments’ in Dirckink-Holmfield, L., Hodgson, V., Jones, C., de Laat, M., McConnell, D ( Ryberg, T. (Eds.)  Proceedings 7th Annual Conf. on Networked Learning 2010 

Permalink Add your comment
Share post
New photo

Citation Networks Activity 15 Block 4 Dawson et. al. (2014)

Visible to anyone in the world
Edited by Steve Bamlett, Tuesday, 14 Jun 2016, 14:26

A.   Comment on the method of partial reading of a paper recommended in the exercise instructions.

B.   How does this paper contribute to my learning about ‘learning analytics?


A.   The recommendations for reading are sensible and coherent, especially when reading papers in volume. First the abstract, then findings (especially graphical & tabular representations thereof, then the practical implications (a final test of relevance to your own research purpose) and, only then, catching up on the research background / literature review material. One function of this method is to test whether the paper will yield any data that matters to you – reading can be abandoned early if found irrelevant, wasting less time and perhaps the trouble, cost (to self and planet) of printing the paper.

In this context, however, I found the method less useful – as with other exercises it led to the risk of reading with a funnel vision, where precisely what I (personally at least) need as a learner is to situate LA in wider contexts of academic and professional development fields. It is issues about the latter that I tended to pick out therefore.

B.   I found two things of interest:

a.    First this paper was the first I have read to emphasize (231) the ‘messiness’ of big data in comparison to the attempts to sharpen the edges associated with classical (especially quantitative) research method. Together with this goes a great deal of concern for the limitations of such data (without denying its obvious strengths). These strengths and potential usages tend, as expressed in this paper (232ff) to present LA as a means of improving the granularity of descriptions of a current state of affairs (238) rather than being predictive. Their predictive quality is totalized mainly in suggesting hypotheses for more rigorous testing.  

b.    Second, it contextualized LA in terms of the SOURCES of the research it fostered. In education, it tended to emerge in hybrid forms and was subsumed within guiding methodologies – often qualitative – whilst where computer sciences where dominant, there was much more openness to simple quantitative reporting (sometimes without a guiding methodology). This view could be dominant in LAK & SoLAR events (238) because of the predominance therein of computer science.

C.   Hence it is interesting to consider the differences in citation between LAK and Google Scholar citations. Whereas the latter may be the home of generic scholarship searches, the former is specialized. Hence LAK citations show no items causing preponderant interest in them. Thus the interest in a specialist Social network analysis text is middling. In Google scholar the number of citations for that same text vastly outweigh interest in other articles. The total range in number of citations is 16680 – 24 = 16656, the range between the SNA text and the next most popular is 16680 – 439 = 16241, hardly less. It is almost as if that text (Wasserman & Faust 1994) was the only one of significant interest in that wider research-led community.

D.   I think therefore one needs to approach LA cautiously and its rhetorical hype more so.

Dawson, S., Gašević, D., Siemens, G., Joksimovic, S. (2014) ‘Current State and Future Trends: A citation Network Analysis of the Learning Analytics Field’ in LAK ’14 231 – 240.

Wasserman, S. & Faust, K. (1994) Social Network Analysis: Methods and Applications. New York, Cambridge University Press.


Permalink Add your comment
Share post
New photo

My Presentation on Social Learning Analytics H817 Activity 13.1

Visible to anyone in the world
Edited by Steve Bamlett, Thursday, 7 Jul 2016, 09:46

The first part of this activity is to make a slide show of the wonderful first paper by Ferguson & Buckingham Brum (2013). 

I'm a bit ashamed of this boring old slide show animation in Powerpoint and mounted onto the web in Google Slides but I really want to move on now. Two EMAs and this TMA04 to do before I go to Edinburgh on 2 August for the Book Festival and a few shows. Click on the following to access:

MY SLIDE SHOW

Here I don't really build up a sense of the fictional framework that I have in mind but it will unfold. Scenario - a fictional university based on unspoken models but using the name invented by Ian McGuire in his first campus novel: Coketown University (the city was first used to represent Manchester in Dickens' Hard Times. [McGuire teaches at Manchester - or did when his first novel came out - his second (this year) North Water is a wonderful examination of cold masculinity]. Mine bears some resemblance to other 'newer' universities.

Coketown university has enormous networks in the local urban decaying industrial and a strong ITC department but this are only beginning to be brought into partnership. One model has been launched - 'Open Up', an arts & social sciences MOOC (my TMA02) & this project PEAR aims to link lifelong learning applicants to employer partners, especially in Health and Social Care. This fantasy becomes stronger, I hope as I work up to TMA04.

All the best

Steve

Permalink 1 comment (latest comment by Claire, Thursday, 7 Jul 2016, 10:48)
Share post
New photo

Analysing the potential use of analytics in Block 2 H817. Activity 12 Block 2

Visible to anyone in the world
Edited by Steve Bamlett, Monday, 4 Jul 2016, 18:31

Analysing the potential use of analytics in Block 2 H817. Activity 12 Block 2

To do this, I have used the model offered in Lockyer et. al. (2012, Table 4:1450). Although I have said I would find this limiting in my own practice (Activity 11 response), it is ideal for me as a novice in use of this process of analysis. I learned a lot from this exercise.

Code for symbols and LO

LO refer to Module Guide (initial letters of LO followed by sequential place (in number form) of specific LOs.  A = Activity in Block, followed by its number.


Number of stage in sequence of Block is within analytics symbol (dark blue)

Figure for start of Block 2 (to A11, omitting A10 (space considerations only)

The following figure represents H817 Block up up to A11 (omitting A10). It represents how Los are distributed between activities. Note that learner activities do not include reading activities per se.

Activity 12

Brief Evaluation

Potential for checkpoint analytics must occur whenever a reading task leaves a trace - whehenever a piece of reading is obtained through a hyper-link or from a repertoire of hyper-links. It may be possible in the latter case to see whether people choose in an informed way (how many links in the repertoire did they access. Hence, in this section lots of checkpoints exist – although as a learner, I cannot know easily (not being very much of a techno) if the information is collected, measured and analysed. Likewise choices of output (blog or forum or both can be checked.

Process measures can occur whenever a group activity is initiated, such as group co-comparison of blog responses and discussion thereof in Social Network Analyses (SNA). The latter represent role and relationships in groups quantitatively (a number expresses the ‘strength’ (relatively of ‘links’ between actor roles. In Lockyer et. al (2013), these are used to diagnose group discussion style, making comparison between more shared participation and discussion centred on one or two ‘dominant’ figures – as in teacher-centric discussion.

Interpretation of such SNA, without qualitative data, would need to be very careful for reasons relating to the concept validity of the measures (what do ‘strength’ measures actually measure) and ethics.

Knowing which information is collected, used and analysed (and for what purpose) is a central ethical issue. Issues of confidentiality and data security arise here. Moreover, post-Snowden, we need to know the reliability of this information about intrusion. Can stealth measures be taken, for instance, outside the LMS’s awareness to register that.

Moreover, we need not only to know how insight into our behaviour is (a) interpreted, (b) transformed into action and to (c) action of what type. Notice my earlier blog on this. If a process is to visualised, interpreted and analysed within my own behaviour then fundamental ethical issues about who owns such processes and has a ‘right; to act on them need to be confronted very openly.

Moreover, if as a teacher I plan for participatory ‘exploratory’ discussion, do I have a right to intervene if I believe that this purpose has been overturned or compromised by any one or two group members behaviour on a forum. I raise this because, to my certain knowledge, such liberties are taken in the OU by ALs currently. They are very seriously under-theorised in ethics and in pedagogy and yet are inevitable without any necessary recourse to interpretations that invoke common values or authority on such matters: netiquette or ‘manners’.

Does a plan give a teacher a ‘right’ to prescribe the limits of learner discursive behaviour that is not illegal? Learner autonomy is at risk here, This is, of course not a function of the technology itself which but creates affordances for this to happen but technology’s ability to intrude is and has been used to validate intrusion.

Permalink Add your comment
Share post
New photo

Learning Design & Learning Analytics Activity 11 Block 4

Visible to anyone in the world

  1. Checkpoint and Process Analytics - what are they?
  2. Demonstrate their use.

Lockyer et. al 2013 Fig 4

This figure from Lockyer et. al. (2013, Fig 4:1450, adapted from Bennet 2002) show how a linear sequence plotted vertically combines elements of learning design used at each sequential stage of the class or work plan (the stages are numbered in the yellow column). For each stage options for the use of LA are given to assess the efficacy of the learning design (Large O is process analytics, star checkpoint analytics.                 

The icons in the columns represent:

Blue triangles = content or tool used

Green rectangles = learner activity

Orange Circles = teacher or peer facilitation

Obviously this represent only 3 facets of LD but we used a number for Compendium designs in H800 and the same could be done here. Here the swim-lanes I used in Compendium are represented by coloured columns. Compendium could be used to create these models using the icons for each swim lane. This does not differentiate content from tool, I would.

In in each line measures can be taken.

1.    Checkpoint analytics count the numbers involved in the process at this ‘checkpoint’ for comparison with other stages of the sequence, our expectations, aims or experience from past use of this class design or another.

1.1. Here we collect:

1.1.1.   No. 1 – The number of learners given the task (and perhaps the number of facilitators if any required to do this).

1.1.2.  No. 5 – The numbers who receive feedback on their project proposal.

1.1.3.  No.  6 - The numbers of those who complete participants involved in thei project and reflection on it or just the project alone.


2.    Process analytics visualize the stage (coded perhaps by their type - as facilitator or learner for instance). Tools for producing such visualizations (Lockyer et. al. 2013:1445)  include:

2.1. SNAPP (Social Networks Adapting Pedagogical Practice) which produces analysis of the social networks in operation at this stage of the design. These represent participants as the nodes of a network diagram and can label the links between nodes with a measure of their ‘strength’ relative to each other (no of contacts might be used to represent this measure). This can show situations such as:

2.1.1.   Peer interactions with equal and shared participation.

2.1.2.   Peer interactions where one (or two) peer (node) dominated the others and mediates all interactions.

2.1.3.   Peer interactions where one facilitator / teacher (node) dominates the others and mediates all interactions (teacher-centric stages of a pedagogy).

2.2. LOCO shows how individuals and groups interact with learning content.

2.3. GLASS shows student and group activity online for monitoring purposes.

 These analytics have immediate face validity to teachers, learners and learning groups.

 Lockyer, L., Heathcote, E. & Dawson, S. G. (2013) ‘Informing Pedagogical Action: Aligning Learning Analytics with Learning Design’ in American Behavioral Scientist 57 (10) 1439 – 1459. 

Permalink Add your comment
Share post
New photo

Library Use Analytics Activity 10 Block 4

Visible to anyone in the world
Edited by Steve Bamlett, Sunday, 12 Jun 2016, 16:06

  1. Do the exercises in 2 & 3 & then re-shape LA definition, if needed.
  2.  List different types of data collected in HE libraries.
  3.  How, if at all, is each part of that data used – based on:

Jones (2014); Collins & Stone (2013); Collins & Stone (2014); Stone & Ramsden (2013) 

Data

Evidence of use as ‘analytics’ in reading

Entry / Exit System

Since a key aim of the data might be resource optimisation (Jones 2014), then the evidenced use of the library building itself would justify its retention or changes to its architecture. This might be particularly useful if loans data (especially ST loans for use within the library) could be correlated against entry.

If there is automated exit data that duration of visit can be collected.


However, Stone & Ramsden (2013:554) show that library entry data was the only example of library data collected in the Lamp Project across 5 UK universities were there was no correlation or a very small one with degree result. They argue that this is because entry was often for the use of group study and discussion rooms (a requisite in some programmes), use of social and / or meeting places or use as a neutral, if quieter, space for an (unknown) purpose.

Loans of Hard Books

Stone & Ramsden (2013:554) show that data collected in the Lamp Project across 8 UK universities showed a positive correlation with degree result. Of course loan does not equate necessarily with reading, use or referencing of the material.  In this study there were possible biases created by the fact that some tutors in some disciplines used the study as a means of encouraging greater library use amongst their students for pedagogic or other reasons (creating subject friendly statistical profiles for instance). We could see a potential Hawthorne effect moreover as a result but only in disciplines which focused the study.  


These loans vary between some demographic characteristics of learners but only slightly, and perhaps inconclusively (Stone & Collins 2013) in Huddersfield – but those results were not necessarily replicated to the same effect in other universities. However, there is a strong effect of study discipline, favouring Health & Social Sciences in Huddersfield but the Arts in other universities (Collins & Stone 2014). It would be difficult to attribute this to the subject discipline per se and may be an effect of differentials amongst staffing of subjects

Use of Short-Term Loans (max. 4 hrs) in the Library

This would be a useful measure (and is potentially available from Durham University’s practice) but I found no evidence of its systematic collection in the studies. Moreover, even in the data collected across universities some did not submit that data (particularly on entry, which strikes me as odd). If that is so for data the libraries had been previously asked to collect, it may be that such data is not yet seen as of value or does not exist.

Online Library catalogue log-ins (duration)

There is no relevant data for the 2013 attainment correlation study but this was a variable tested between study disciplines, showing an effect size only for Arts compared to other disciplines (p. 4). Is this however, because non-copyright texts are available for reading free online. However, in fact this is probably not the reason at Huddersfield since most of the effect for Arts was created by one subject discipline, Music, with uncertain causation – and possibly one created by combination with another non-Arts subject.

Online Library e-resources accessed and /or  downloaded

As with hard books, Stone & Ramsden (2013:554) show that data collected in the Lamp Project across 5 of the 8 UK universities showed a positive correlation with degree result (3 did not submit but it is not clear why). In this study there were possible biases created by the fact that some tutors in some disciplines used the study as a means of encouraging greater online library use amongst their students for pedagogic or other reasons (creating subject friendly statistical profiles for instance). We could see a potential Hawthorne effect moreover as a result but only in disciplines which focused the study.  

Online Library PDFs  downloaded

There is no relevant data for the 2013 attainment correlation study but this was a variable tested between study disciplines, showing the largest effect size for Arts compared to other disciplines (p. 4). Is this however, because non-copyright texts are available for reading free online.

Revised definition of LA

Here is the old definition:

Steve’s definition:

A process of analysis which produces actionable insights by the application of analytic methods appropriate to their contexts.

New definition:

A process of analysis which produces actionable insights related to teaching and learning (TL) by the application of analytic methods appropriate to their contexts. It is applied to a number of issues important to the design of TL, including environmental and other resources, such as libraries. (updated 12/06/2016)

Collins, E. & Stone, G. (2013) ‘Library usage and demographic characteristics of undergraduate students in a UK university in Performance Measures and Metrics 14 (1) 25 – 35.

Collins, E. & Stone, G. (2014) ‘Understanding patterns of library use among undergraduate students from different disciplines’ in Evidence-Based Library & Information Practice 9 (3) 51 – 67

Jones, M. (2014) ‘So what do we mean when we say ‘Analytics’ In LAMP. Available at: http://jisclamp.mimas.ac.uk/2014/01/09/so-what-do-we-mean-when-we-say-analytics/ (Accessed 09/06/2016).

Stone, G. & Ramsden, B. (2013) ‘Library Impact Data Project: looking for the link between library usage and student attainment’ in College and Research libraries 74 (6) 546 -559.

Permalink Add your comment
Share post
New photo

A personal reflection on Learning Analytics and the meaning of research: based on Activities 7 – 9 H817 Block 4

Visible to anyone in the world
Edited by Steve Bamlett, Saturday, 11 Jun 2016, 20:00

Note in your learning journal or blog which of these questions can be considered:

a.data driven

b.pedagogy driven.

Teaching and learning exercises often come from above (by a course, textbook author or a teacher) and arrive on the learner’s ‘to do’ list unbidden and not fully understood. The exercises from Block 4, Nos. 7 – 9 appear to be one such instance.  Constructing in 7 a concept called ‘data-driven questions’ and in 8 ‘pedagogy driven' equivalents, this question asks you to test these constructed concepts on a number of questions not devised for that purpose and included in a paper that does not, fundamentally, require you to make this distinction.

No wonder then, one might think, it will be possible to have questions and declarative statements (the 2 source tables carry each respectively) that do not meet the constructed criteria.

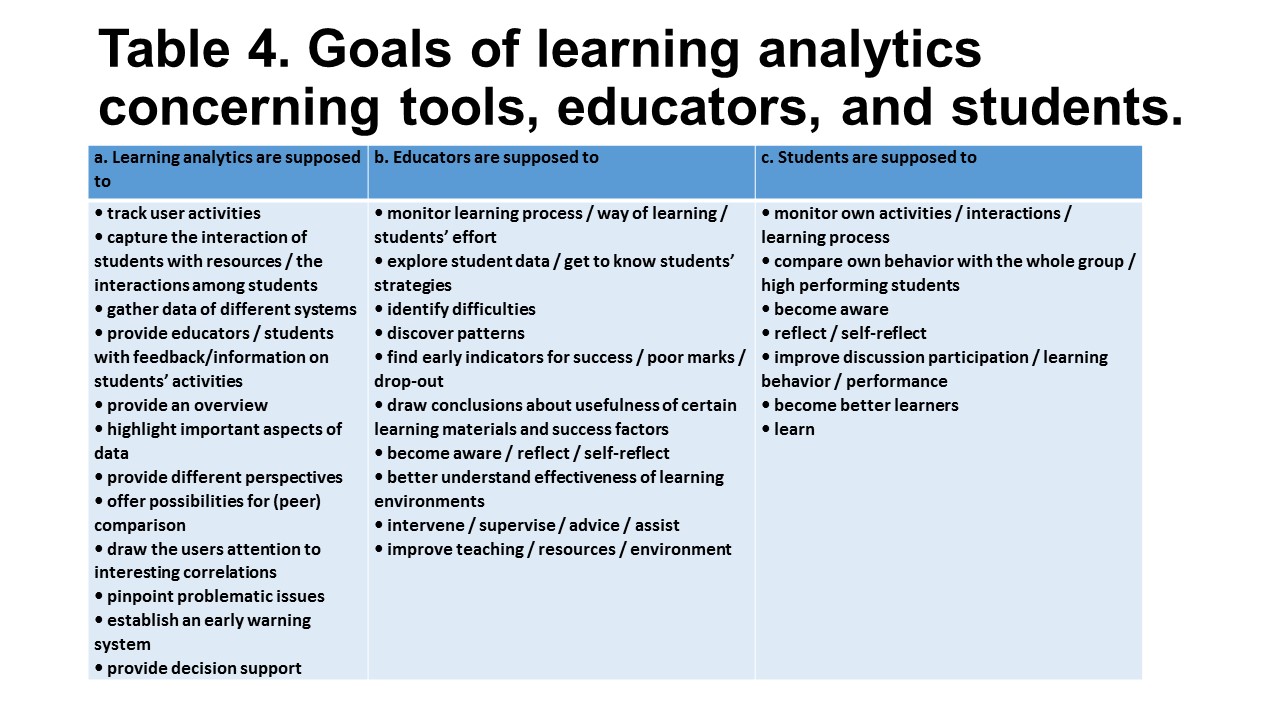
On top of this, we must treat the declaratives in Table 4 as if they were questions like those in Table 2. To do this, you would have to rephrase the latter and, in that act, might lie some of the variables that will impinge on their categorisation. Thus: ‘Learning analytics (LA) is supposed to track user activities’, could be phrased, ‘What user activities is LA supposed to track?’, or ‘Why is LA supposed to track user activities?’. These two questions have a different degree of implicit (at the least) pedagogical concern behind them but perhaps the second demands answers that address some active purpose, perhaps even that of pedagogy.

I explain that at length because I’m embarrassed by not wanting to try to meet the requirement of this activity. It feels to me not to be a useful exercise and I feel my time is limited by the demands of a TMA that I can meet in other ways (such as by reading Dyckhoff et. al. 2013 critically and discussing it, rather than concentrating on 2 of its tables mainly). Of course, the issues of import might no doubt come out in discussion but it strikes me that each learner needs to have some trust and some way of pre-evaluating exercises given to them. So, at the cost of seeming difficult, I feel I have to express this.

In the pre-amble to Activity 8 where ‘pedagogy driven analytics’ are defined, we are told that:

This approach uses the pedagogy of a course to help frame and focus questions that can be answered by analytics:”

This definition begs so many questions. Different pedagogical theories stress different ways of framing questions and have a different view of the kind of data and evidence that might be used to answer them. Many courses use multiple pedagogical theoretical strands in the definition of what they do. Therefore, the best approach to this isn’t, I believe, the work expended on Activities 7 – 9 but taking seriously the reading offered to us as learners, particularly learners operating at a Masters’ level.

In Dyckhoff et. al.’s (2013:220) introduction, the authors make a distinction that is like that between ‘data versus pedagogy driven’ (which clearly somebody understands on this module or these activities would not have survived) but easier to grasp and to implement in Activity 9 than the former. We are told there that LA, as opposed to action research, devises categories that may be used as indicative of events (what they are it doesn’t at this point ask) :

‘Hence the indicators might solely represent information that depends on the data-sources used, e.g. by just making the data visible that has been “unseen, unnoticed, and therefore unactionable ... ‘(whilst action research thinks) ‘… about the questions that have to be answered before deciding about the methods and data sources.’

That in a nutshell is the distinction we need to understand the relationship between research into pedagogy and the provision of data that may or may not be important in understanding pedagogic practices. Yet the published piece makes this absolutely clear distinction without introducing the concept of ‘drive’ or ‘motivation’. In what sense can data ‘drive’ a question, such that it does not demand that further questions are asked?

I want to take one example from Table 2 (c) which intrigues me, and I’ll try out the activity on it, in a manner the issue deserves (it is after all a question about the politics of educational provision):

‘Do Native speakers (NS) have fewer problems with learning offerings than non-native speakers (NNS)?’

On the surface this merely asks for a quantitative answer, provided of course we can agree on an operational definition of a ‘learning offering’ and a ‘problem’. In effect both would be extremely difficult to operationalize without consideration of matters of teaching and learning.

Let’s assume though that we know what we mean by both terms, such that NS have x problems and NNS have y. Suppose further y > x. We have a piece of visible data about which action could occur – but what action? Clearly this then is data-driven! Well, yes, it is - provided we already know that data on ‘problems’ with ‘learning offerings already exist. Perhaps we have decided that such problems can be represented by the number of queries made to the tutor.

As we go on piling on assumptions here, we see that we can’t have avoided pedagogic questions, even though we did not include them explicitly in the question. For instance, what constitutes a ‘learning offering’ to a NNS will depend on how well the ‘offering’ has accommodated itself to their pre-known needs.

What scenario does this question address? Let’s imagine that it addresses a class of 15 year olds in Germany containing a mix of ethnic groups. In each ethnic group there are speakers (people from Turkey, Somali, Tunisia – speaking both French and Arabic but no German) and who use English for different reasons if they use it all and at different levels of competence in relation to its purpose. The ‘learning offering’ we are considering is a scene from Bertolt Brecht’s ‘The Caucasian Chalk Circle’ to begin conversation on the meaning of ‘being native’.

Could a ‘learning offering’ be constituted by giving all the class the ‘scene’ in a photocopied text in the original German? Would not such ‘problems’ that might arise not have been predicted from the very beginning of the teacher’s preparation. In doing so, has s (he) provide different resources for different groups – used the differentiation principle in teaching theory.

So where does the distinction get us. This question demands a data-based answer perhaps but you would ask it without knowing the difficulties that already interact in the way we define ‘learning offering;’ and ‘problem’ - implicit questions of pedagogy.

And then we get to what the reading might have offered us without the activity as, I believe, an unintended distraction. That is that research orientations to data focus on research questions while ‘learning analytics’ does not necessarily do so. There, it’s easy!

Further, we learn about pedagogy by asking questions about its experimental implementations and seeking methods and data to answer these questions not merely ‘eyeballing’ (as we psychologists have it) newly visible data without such appropriate questions. In the end the action demanded of insight is to validate and maintain or find evidence of something wanting and change that pedagogical approach or an element of that approach.

I think reading the paper set could bring us to this insight but equally I think the activity might have done that too (for some people). What it could not have done so easily is raise the issue in Dyckhoff et. al. (2013:22) that perhaps learning analytics (even if entirely ‘data-driven’) can add something to (pedagogy-driven) action research that we would not have got from action research (or the ‘pedagogy-driven) alone.

With more practice of LA in everyday life, other ways might appear to measure the impact of LA.’

That is what I’m missing in our activity – the sense that ‘big data’ is emergent and may raise questions that research methods, as we currently know them, would not. I don’t know. However, this is precisely what some claim and what I would like to know more about from this module. After all LA is already statistically driven – by virtue of the correlations it makes available to us. At this point, the researchers jump in – but ‘correlation is NOT CAUSATION’. Of course. But witness this claim from Mayer-Schönberger & Cukier (2013: Loc 234):

In a big-data world, we won’t have to be so fixated on causality; instead we can discover patterns and correlations in the data that offer us novel and invaluable insights. The correlations may not tell us precisely why something is happening, but they alert us that it is happening.’

With that claim goes another. We would not have been thus alerted from research process alone – at least not in a timely manner. This is something I want to know about.

In Collins & Stone (2014) librarians at the University of Huddersfield (where I come from - Huddersfield that is, not the University) discovered that huge discrepancies between a range of indicators of library use across different disciplines that did not match previous research. This led them to understand that local issues – almost certainly ones differentiating the pedagogic approaches of different disciplines had driven this finding otherwise invisible to them. The next step is research based on questions – but the questions would not have come about at all without the big data.

Collins, E. & Stone, G. (2014) ‘Understanding patterns of library use among undergraduate students from different disciplines’ in Evidence-Based Library & Information Practice 9 (3) 51 – 67 ISSN 1715-720X.

Dyckhoff, A.L., Lukarov, V., Muslim, A., Chatti, M.A. & Schroeder, U. (2013) ‘Supporting Action Research with Analytics’ in Proceedings of the 3rd International Conference on Learning Analytics and Knowledge (LAK’13) 220 – 229.

Mayer-Schönberger, V. & Cukier, K. (2013) Big Data: A Revolution that will transform how we live, work and think London, John Murray.
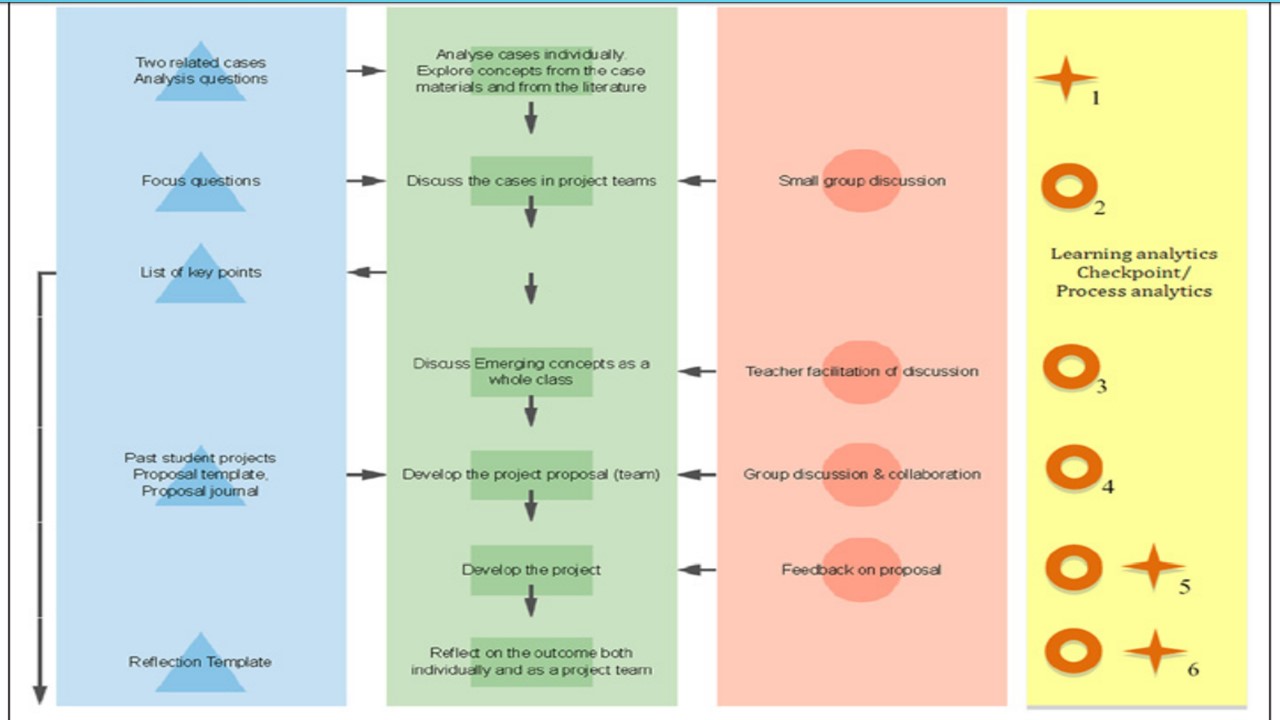
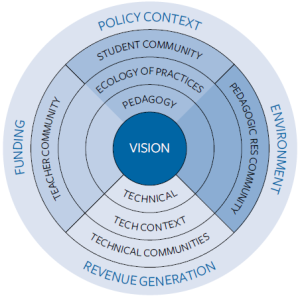

Permalink Add your comment
Share post
New photo

Reflecting on my resistance to Stealth Assessment H817 Activity 7

Visible to anyone in the world
Edited by Steve Bamlett, Monday, 13 Jun 2016, 14:30

·         Write a reflective piece in your learning journal or blog about how these data could be used to generate learning analytics, together with any problems that might be associated with their use in education.

·         Make reference to any occasions on which you have been presented with or had access to any of these data during your own learning and teaching, and share these experiences in the forum or in OU Live if they are not private or business sensitive.

This is personal and is a means of achieving some closure on my one and only known brush, as a learner, with learning analytics. I don’t think I will advance much until I have exorcised this ghost – hence I’m not even going to try to be objective about the uses of data. At the moment, I feel I could not go much beyond the Rebecca Ferguson paper I took notes upon. This is going to be my framework for ‘uses’ of big data in education. This is about ‘a problem’. I still don’t know whose ‘problem it is.

About 2011-12, I was working on a PG Diploma on Mental Health Social Work at the University of Northumbria. A pilot course at the time involved distance teaching and learning on ‘Mental Health Law’. At the same time I had just started in a role in social work as an Advanced Practitioner, after working in Assertive Outreach.

The job was tough (and not right for me) and for lots of reasons, I fell behind on my study but particularly on the distance course. I had planned to cover it during holidays and breaks from work but they would not happen until one month before the viva-voce law exam.  Just before that time, I received a letter from the University to say that my recorded use of the distance website for Law was insufficient and that I was going to be removed from the module. There was no consultation – that was it, a decision entirely based on the traces of use (or lack of them in this case) recorded by the University’s LMS. In my view, this decision took no account of:

  • ·         The learner-focused reasons for delayed use;
  • ·         The realities of full-time social work;
  • ·         My own plans for autonomous control of my learning and access to teaching.

It took an appeal meeting to the Head of Course, attended by my manager, to over-turn this decision and that with little or no acknowledgement from the original decision-maker that such decisions ought to involve the stakeholder most concerned. The only reason given was the evidence stored, and made available to the meeting from the LMS  and which the original decision-maker still believes, as far as I know, necessitated this decision.

After the decision was over-turned I worked, as I knew I would (in my holidays), on the law blending online and offline elements of my own preferred Personal Learning Environment. Although this module was ungraded, the external examiner told me that I achieved one of the best scores and performance indicators given.

In the end, this was all to nought. As my health turned to the worse, I fled job and course (finishing it later at a lower level, because I no longer was able to take the practice-based element necessary for that level). In a sense then the ‘prediction’ from LMS data was correct, in that my retreat from the law course contact (known via recorded page visits) might have been the first step to this general disillusionment. At the time though it felt like an imposed stressor rather than stress relief.

Maybe, that tells us only that data itself can’t make decisions and, even if they form their basis: mediation of such decisions without the benefit of personal interaction is hardly likely to look or feel pleasant or convince one that it represented a step to meeting one’s own ‘best interests’. These incidents were recalled to me as I read some of the early documentation about the trials in ‘learning analytics’, of which this module was an early experiment. Raising the issue of whether or not to tell ‘learners’ of the stealth involved in their surveillance still seemed then (between 2006 and 2009) potentially ethical – to stop learners getting the ‘wrong perception’ about institutional intrusion into data based on what they might have believed to be their personal experience,

But this story is not about a false perception about intrusiveness but rather about a belated true perception of an intrusion used to guide idea at a time when it was almost too late to do anything about it. An ‘actionable insight’ indeed.

Were one convinced that  issues in the use of power and control in teaching were always issues in which a learner’s ‘best interests’ were served, one MIGHT (only might) see an ethical case for them. My subjective impression is that academic life is still potentially prey to actions that are based on gaining power advantage – and not just in campus novels like ‘Small World’ or ‘Lucky Jim’. Unmonitored power inequalities and stealth surveillance by one group over another do not marry together well. Hence, I really believe in Rebecca Ferguson’s (2012) view that the existence and dissemination of ethical codes and practice guides is a necessity in this area as in many others. It cannot – it should not – be delayed and it must involve all stakeholders.

There – I think that ghost is exorcised!

Permalink Add your comment
Share post
New photo

Rebecca Ferguson’s Overview of Learning Analytics (LA) H817 Activity 4.5

Visible to anyone in the world
Edited by Steve Bamlett, Sunday, 12 Jun 2016, 09:50

NOTES for later:

The key point in the introduction is that, although a lot of effort can go into differentiating categories of things that are and are not LA, the point is that these differentiated activities each appeal to the interests of different kinds of stakeholder in the enterprise, each with a distinct approach:

  1. ·         business intelligence,
  2. ·         web analytics,
  3. ·         educational data mining (EDM), &
  4. ·         recommender systems.

The point is to bring these distinct approaches, if not the original stakeholders themselves together in some participatory manner. The paper focuses on academic analytics and EDM as approaches requiring a rapprochement.

Driving Factors

1.      Big Data: particularly turning the raw data (over-abundant, lacking [evident] connectivity externally and internally) into a visible usable form (into VALUE) by:
a.       Extracting from it,
b.      Aggregating parts of it,
c.       Reporting,
d.      Visualization(s) of it.


2.       Optimising it to facilitate more effective online learning.


3.       Using it politically – measure, demonstrate & improve performance. My feelings here (see Activity 4.2) are that there is a danger in confuting ‘intelligence’ with political interests. Knowing about inequality does not change it and may just validate it.


4.       The role of stakeholder interest groups:
a.       Government
b.      Education providers
c.       Teachers / learners.

EDM – techniques in computing:

  • ·         Decision tree construction
  • ·         Rule induction
  • ·         Artificial neural networks
  • ·         Instance-based learning
  • ·         Bayesian learning
  • ·         Logistical programming, &
  • ·         Statistical algorithms. (LOOK ALL THESE UP, Steve)

Good quotations here on use for teachers & learners (Zaïane 2001) on EDM for PEAR.

Learning-focused perspectives – pedagogy.

Social Network Analysis (SNA) – ‘considers knowledge to be constructed through social negotiation.’

  • ·         Networks
  • ·         Actors
  • ·         Ties – strong & weak (frequency, quality & importance)
  • ·         Promotion of collaboration & co-operation.

Dawson (2008) – read.

Ethical issue - should students be told their activity is being tracked’

 Uses in Learning are:

  1. Discourse analytics
  2. ·         Content analytics (metadata development)
  3. ·         Social learning analytics (‘sentiment into account’) – computers & emotional support
  4. ·         Metacognition (GRAPPLE) Mazzola & Mazza 2011 – my note: I found Bull 2016. (VERY IMPORTANT PAPER FOR ME)

Challenges

  • 1.       Connect to pedagogic science more
  • 2.       Widen range of datasets used
  • 3.       Learner perspectives as the focus – include transparency (NB for PEAR)
  • 4.       Clear set of Ethical Guidelines.

Permalink Add your comment
Share post
New photo

Comparing Greece and Germany H817 Activity 4 Part 2

Visible to anyone in the world
Edited by Steve Bamlett, Wednesday, 8 Jun 2016, 21:47


Average performance  of 15 yr olds in:

OECD Average

Difference between OECD Average and Greece

Difference between OECD Average and Germany

Difference between boys & girls performance

 y           reading

496

- 21

+ 12

Greece                                                                                                                                                   50 to girls Germany                                                                                                                                                 44 to girls

maths

494

-  41

+ 20

Greece 8 to boys

Germany                                                                                                                                                 14 to boys

science literary

501

- 34

+ 43

Greece 13 to girls

Germany                                                                                                                                                 1 to girls


The discrepancy between Greece and Germany at national levels in relation to average performance is startling (particularly for science literacy and maths). Gender differences are similar in both countries, suggesting that this is an effect of national characteristics that can’t be attributed to cultural differences in an easy way.

However, they may be attributable to national debt effects (reduced services and family incomes, as well as low expectations amongst school-leavers for employment).

My belief is that this economic difference is likely to be much greater than any effect of any adjustments that learning analytics is capable or competent of producing – especially given the exceptionally high correlation (highest in OECD) of socio-economic status and access to preparatory education in Greece.

I’m as sure as I can be that no stealth assessment will help to raise Greek performance without overt attention to the deliberate impoverishment of Greece brought about by EEC demands that the answer to the problems of the Greek economy must lie in reductions in national public spending and economic deflation. In fact Greece is being deliberately underdeveloped by more developed economies like Germany for getting above itself politically. Although, of course the corruption in the internal system hasn't helped.

In fact, I can’t see what the question here is getting at, since no conclusions can be arrived at where learning analytics is the first line of response to bring about change.  

All the best

Steve


Permalink Add your comment
Share post
New photo

Old Lamps - A kind of Learning Analytics in which the genie died - H817 Activity 4 Part 1

Visible to anyone in the world
Edited by Steve Bamlett, Wednesday, 8 Jun 2016, 16:23

o    Campbell et al. (2007), Academic analytics.

o    Norris et al. (2009), A national agenda for action analytics.

·         Consider the reasons for the use of learning analytics that are given in these papers, and reflect on them in relation to the recommendations you and others made in Activity 3 and the problems that you thought learning analytics might be able to address. Make a note in your learning journal or blog.

Notions of ‘actionable intelligence’ emerging out of mass data sets appealed in the world that Tony Blairwas about to  inherit and develop as prime minister. You only had to say ‘Education’ 3 times to show that it was all a matter of intelligence about quantities that could, by the right statistical techniques, be put into the right combination to fire growth. Tony Blair’s ‘modern’ (now gearing itself for power) had as much of Amazon about it as Anthony Giddens. The ‘third way’ was an administrative panacea for mass enlightenment that no longer required fundamental changes in the value systems of individuals or groups The feel of Campbell et. al. (2007:44) is similar:

‘Today, analytics is most often used in HE for administrative decisions – from delivering the targeted number and quality of a freshman class to cultivating likely donors.’

Predictive modelling would work – even though it was still having a hard time showing anything like working in the NHS and support services. A lexical canon of problems required only the right analytic to make them manageable: retention being the buzz word.

By Norris et. al. we had Tony now in Downing Street – modelling himself on Clinton (the male one). The idea of the new that was also even magically a kind of democratisation of process and all by virtue of number-crunching is of a piece with its times. We replaced values with assessment of value (p. 3f) (an amalgam of outcomes expectations, experience of the process and cost.

My note is simple then. No education worth its salt emerges from such a corporate vision. I intend in TMA04 to look at the role of learning analytics as it takes quality back into equation and makes genuine choice and self-regulation possible, even within participatory processes and in large numbers. That is what I’m aiming for in PEAR.


Permalink Add your comment
Share post
New photo

PEAR: A Possible Fictional Education Company for H817 TMA04

Visible to anyone in the world
Edited by Steve Bamlett, Tuesday, 7 Jun 2016, 07:29

Pear Company (Fictional) Ad

Permalink Add your comment
Share post
New photo

Considering the phases of educational growth and response to academic demands

Visible to anyone in the world
Edited by Steve Bamlett, Tuesday, 7 Jun 2016, 07:45

Considering the phases of educational growth and response to academic demands

Studying E845 on ‘Language in Action’ can be an unnerving thing even at my age. I find myself reflecting on very basic issues of learning, teaching and assessment (especially incremental course work assessment - the OU’s TMA system).

The Problem

In E845 a lot of ground has to be covered on the learning journey:

  1.  understanding of the possible relationships between theory and practice in applied linguistics;
  2. he fundamentals of conventional taxonomy of language as spoken and written – phonology, morphology, semantics, syntax, pragmatics. 
  3. The fundamentals of Halliday’s Systemic Functional Analysis method and its later developments into practical applied use; 
  4. The fundamentals of Critical Discourse Analysis as a means of hybridising the discourses in 1 – 3 inclusively; 
  5. Ethnography as a disciplinary alternative to 4.

So much of the potential in working on a project and perhaps a later Master’s dissertation relies however on completing this journey. However, the module deals with its abundance of material and alternative analytic perspectives by PHASING them, one after the other and testing (summatively) each as it ends. 

This is in micro the job of the educational project of child education seen as an induction through phases of material. The phases are organised by virtue of the level of cognitive readiness assumed to be ready to receive it. In macro (and related strictly to child developmental matters), this explains the role of Bloom’s taxonomy as a means of phasing the tasks that equate with intellectual , cultural and personal development and growth.

In E845, questions raised in (1) about the role of corpora in critical thinking about language only really get addressed practically in the Study Guide in Section 5. Likewise early rabbits set running around the theme of hybridity in (1) – Kramsch, O’Halloran - are interpreted sufficiently only in the ,light of material also in Section 5 – where different uses of the concept are juxtaposed – Coffin and O’Halloran on critical readings of media and Fairclough on Thatcherism respectively.

This is where I am currently in the module – so I don’t yet know how the Ethnography section might further stir the pot. But one discovery stuns me.

I struggled with TMA04 because it demanded, or appeared to do from my working analysis of it, a perspective on the task that was relatively naïve about SFL’s role as a critical tool in linguistics – one that only got made more complex in the section following TMA04. Now, as I re-read the Study Guide, I see that I was supposed to read the early parts of the CDA section of the materials, containing a more complex take on SFL whilst working on TMA04. I didn’t because I thought that would create too many demands at the same time.

Hence TMA04 was experienced by me largely as an expression of my tensions with what I believed to be assumptions of the task given. To me, the task personalised ‘problems’, focussing on the set text writer's ‘problems’ as a writer. Personally I saw the problems in terms of instabilities in the social situation and culture that set the task up for the writer in the first place. Had I read the material in (4) I think I would have been ready to cope with that, I think, and not be as suspicious of what felt to me (at that time) double-standards in the course.

These confusions were expressions I believe now of the contradictory experience brought about by phased learning in conjunction with continuous summative assessment. What I can’t decide is whether these are inevitable to any pedagogic schedule or not. Clearly the idiom about ‘not running before you can walk’ applies here. One needed to see at the outset some of the range of SFL without over-playing its use in rigorous critical social analysis. But I wonder how fair it is to make summative assessment exercises out of such interim understandings.

For me, this illustrates the shortcoming of continuous assessment, especially at Master’s level when the pace and quantity of learning has to be fast. Summative assessment during a period of formative growth is bound to confuse. It enforces a need to linger at the level of interim understandings. Had interim understandings been assessed equally thoroughly but formatively – with feedback systems still there – it is possible that that halting of process of growth would be less jarring on the uneven paces of synaptic growth they probably get represented by in biological terms.

These reflections are in no way an attempt to critique E845 because I realise now it does a difficult job well but it is meant as a critique of the concentration on continuous assessment as a summative measure of achievement. Surely there is a better way? I look back now to the 1970s when no HE, or little involved much summative continuous assessment but concentrated all that on an end-process. That had its problems of course, but I do remember that we all did formative essays – precisely to learn from feedback and not just institutional feedback, that that came from the felt expansion of our repertoire of knowledge and skills often across difficult and resistant thresholds. Much of the most painful learning was feeling my ideas obstructed as I worked on an idea as if it mattered rather than to meet external criteria.

One possible solution is to also set assessment tasks as a role-play in which the perameters of the enquiry are set by a work role or something of that nature. 'Your task is to instruct the Spanish speaker of English here to write a better film-review' perhaps. Something totally unambiguous and not demanding an account of a set-text per se.

Is that anywhere near as possible when so much of continuous assessment is focused on formal matters – and where ‘teachable’ issues like structure, referencing and so on (the stuff of convention) often take precedence in the mind of learners to developing critical thinking? 

If that is so (and I hope it is not) it is because a generation of teachers (like myself) have laid the groundwork for it in our dislike of end-of-term exams and I wonder now if we are exactly right!

In brief – phases in learning can become places to stop (perhaps forever) if the meaning of a ‘phase’ is not stressed as ‘moving on beyond that phase’ rather than ‘proving your attainment in each and every phase by lingering, like an unsatisfied ghost, within it’.

All the best

Steve

Permalink
Share post
New photo

Multi-modal writing: Devising Charts to communicate linguistic ideas

Visible to anyone in the world

I used this chart in an E845 TMA to talk about lexical effects in a piece of writing that simulated film-review to illustrate lexical specialisation (even if at a low level).

Permalink Add your comment
Share post
New photo

Mashup as a means of providing developmental feeedback

Visible to anyone in the world
Edited by Steve Bamlett, Sunday, 5 Jun 2016, 20:35

In E854 TMA04, we are asked to discuss a piece of writing by a Spanish English-speaking learner in the form of a film-review. In that 'review' (an 'impure' or hybridised genre), he also recounts the story of visiting the cinema. Here is a mash-up I use to introduce into the developmental feedback points related to both his achievement and to EFL LEARNING. In this exercise, I concentrate on tense and aspect in verbal groups.

Note: I am assuming the writer is male but we are not told. The next assumption this makes therefore is that of heteronormativity.Mashup as a means of creating developmental feedback on a learner's writing

Permalink Add your comment
Share post
New photo

‘Big Data’, Ethics, the OU and Me: H817 Block 4 Activity 2

Visible to anyone in the world
Edited by Steve Bamlett, Friday, 3 Jun 2016, 16:12

‘Big Data’, Ethics, the OU and Me: H817 Block 4 Activity 2

There is something predictably uncomfortable about this material but it isn’t that the material shocks me, because to some extent I feel already habituated to it and the classic arguments about it. I suppose, given Duhigg’s (2012) exposition of the role of harnessing ‘habit’ and its sustaining behavioural mechanism (‘cue – routine – reward’), it is that one effect of this process of re-reading these arguments is that they themselves have become disempowered as cognitive stimulants to action. Habit deactivates any though from the behavioural loop (which once ‘chunked’, is no longer in itself forceful or stimulating): just like the rat’s experiences in the maze.

A secondary reaction is that, in the context of this course I do not want to waste thought on Amazon (use of which I treat as a guilty open secret). Is this because:

  1. 1.       I have found the allure of its methods, to every possible extent imaginable, irresistible. I think it is. The benefits to me of the Amazon method (as a book-buyer and reader) is that its ‘control of serendipity’ (now there’s a paradox I hadn’t cottoned onto till reading Mangalindan 2012) is experienced, at some level very positively by me. I feel rewarded by the discovery of novels and academic approaches that I hadn’t before known I might be attracted towards. This feels as though it fits into a need to ‘learn more’ and ‘more widely’.

At the other extreme it has cued immense changes in me as a reader and learner. A literature search process yielding no serendipitous discovery feels to me now a very limiting experience – but another offshoot of this cued behaviour is that I spend much more than my income supports, on books at least, and use library ‘book searches’ much less – for hard books. I also feel I have developed the equivalent of FOMO (Crook 2016) as a reader – especially with regard to current literary fiction.

Yet these disadvantages continue to reward as well. Hence I can’t respond simply to the request to apportion positivity and negativity, loss or gain in the simple binary way demanded by Activity 2. The issue is so complex, the relationship between positive and negative more multi-dimensional and nuanced than this course appears to require – and certainly its short report-like assignments can easily accommodate.

  1. 2.       I’m more exercised about how these issues are being played out in the OU’s LMS on ME at this very minute. It goes without saying that, at the most basic level of analysis (which is not necessarily the sum of all analyses that can be made), Amazon is driven by ‘self-interest’, what seems more obscure is what interests might drive learning analytics and how they might be operating on me at the minute of writing this. These issues need ‘parking’ however until later, when I hope our experience on H817 and its acknowledged (and potentially unacknowledged) motivating factors in different stakeholders will itself be the object of our reflection.

What comes out of that digression then is that it is the issue of stealth in the operative application and use of ‘big data’ collection that really exercises me. I note, in particular Duhigg’s (2012) discovery that the more he got to know about the work of Andrew Pole and Target, the more reticent to share information they became. My concerns come from reflection on this issue. As usual the base enemy is behaviourism, its assumptions and its ‘parentist’ self-justifications.

Just to elaborate on that. Duhigg (2012:5) shows that behavioural learning is closely associated with the operations of the ‘cognitive miser’ mechanism in learning. We automatically (and perhaps voluntarily) resent expense of energy on cognition in a learning situation, yearning for the moment when the learning processes are ‘chunked’ as routine procedures and stored in the cerebellar brain and the meaning of what we are doing lost from consciousness in routine procedures. For me the problem lies here, only cognition (and meta-cognition more so) can allow us to process our behaviour ethically. 

Hence Target’s ‘pregnancy-prediction-model’ appears to not only benefit them (in allowing a window of opportunity to lay down buying habits in their favour in new parents) but even the father of a young daughter who learns earlier than he might have done of his daughter’s pregnancy. His apology to Target nauseates me. 

After all, the true ethical issue here is that the daughter has been put into a position where she must share that news at a time NOT CHOSEN by her but (incidentally) by Target. This robs her of the autonomy of moral decision making, and in some cases might endanger her or her baby’s life (what for instance if the father had been a moral or even physically violent bully). This taking away of moral ownership around decisions is particularly important in education. Hence, my concern about H817.

For instance, using means to engage me in good study habits (for my own ‘benefit’) could be taken and implemented using similar methods – clues to the cues and rewards I get from learning being legion in the data traces left on the OU LMS’s H817 data banks. But have I empowered anyone to make such decisions or even the ‘assessments’ (openly acknowledged as stealth assessments) upon which decisions could be made. The answer is, of course, NO.

However, I cannot know whether this is happening or not. Maybe this ethical issue worries me more than any other. I have to say that the worry is not for myself – if anything I’m happy to share with people more information about myself than they need (or even want) to receive. It is for OU learners, whom I know from experience as colleague learner or tutor, use the OU precisely because they are undergoing life transitions (unemployment, divorce, sudden loss of income etc.) that open them up to behavioural change (Duhigg 2012:12f) because of the threat those life-changes make to their prior ‘assumptive world’.  

Hence, my reaction here is to a corporation that pays me as part-time employee and serves me as a learning provider – the OU. My concerns are characteristically ethical. I can’t begin to talk about ‘benefits’ and their opposite really until I have a handle on this. For me, education is about responding to limitations in a prior value system and some challenge to that value system by learning how to re-evaluate important features of one's life. It matters that this can be done by stealth and justified as ‘in my own benefit’ without me being at least involved in both of these decisions. I need to work on this issue and, in doing so it may become the beginning of preoccupations in TMA04.

All the best

Steve

Permalink
Share post
New photo

Defining Learning Analytics (LA) for Myself H817 Activity 1, part 2.

Visible to anyone in the world
Edited by Steve Bamlett, Sunday, 12 Jun 2016, 16:04

It is not necessary to read Part 1 first but if you want to, click here: Part 1

This preliminary account of the set reading aims to assist me to reflect on problems of definition of emergent concepts in general before attempting a working definition of LA for myself. This matters to me because the aim of this exercise appears to be the creation of a ‘definition’ that can be revised following a number of experiences:

  • ·         Reading ‘definitions’ produced by others in the TGF;
  • ·     Ongoing acquaintance with new definitions;
  • ·         Use of one’s own definition and reflective evaluation of limitations and strengths of the definition that arise by virtue of that use. Use occurs in:

o   TGF discussion

o   Blog writing

o   TMA preparation

o   Etc.

The exercise appears to suggest that definitions that prescribe the meaning and function of the concept are less important than those that facilitate its ongoing and emergent development as a concept. This seems a liberating potential, although it also seems potentially naïve, since certain definitions are awarded more status, authority and respect than others in ways that reflect quite robust power structures external to any use I may make of the term. But clearly there can be interaction between the term as currently used by its socially validated champions and my use.

This is the framework I want to go into this exercise with, at least. This first trial is therefore based entirely on my own interpretive synthesis of the limited reading set for this exercise.

In speaking of this reading another preliminary strikes me. The paper by Cooper (2012), although published only one year after Long and Siemens (2011), appears to me of a great deal more mature and less hyperbolic than the latter.

In Long & Siemens (2011), the taxonomy which allies and differentiates it from ‘academic analysis’ appears to be entirely based on the hierarchical structures which frame the corporate framework of universities as presently constituted. This is disguised in the tabular presentation of that relationship on printed as Table 1 in the paper. Pondering this table, I was conscious only of what, in the work of HE, it omitted. This model barely acknowledges interactions at levels lower than the department or course. Where, I ask myself, are individual teachers and learners in all this at the micro-level of the university’s operation?

This led me to see that the diagram needed reconfiguring precisely as a hierarchy to show that missing level and to query whether LA in this paper is not too bound in purely corporate terms. Here is my go at that (Fig A).

Of course, we see here that teachers and learners are represented here as beneficiaries of departmental operations. Such a role offers them, as individuals at least, relatively NO agency in LA. Even in the abstract, this is not ‘good enough’.

I don’t for one minute that corporate interest in LA will go away – it is, after all, what it shares in common with other corporations who initiated predictive analytics, like Amazon.

That is what attracts me to Cooper (2012) who shows that LA will be reconfigured in relation to the domain it belongs and that that relationship does not necessitate a pyramidal power structure (as I try to show in my version (Fig. B). Hence he pictures the instantiations of LA in Fig 1 (p.6) as satellite ‘domains’ to a ‘HUB’ concept. Those ‘domains share features with each other but, potentially at least might shape themselves differently – into ‘flatter’ power structures for instance.


Having said that, should we accept Cooper’s HUB definition. It seems strong and my knowledge base isn’t strong enough to improve upon it. Here it is as MY definition, a little expanded:

Steve’s definition:

A process of analysis which produces actionable insights by the application of analytic methods appropriate to their contexts.

At the last minute, I decided not to commit my hub definition to the primacy of statistical models as analysis and hence (not yet till I have read & experimented further) to quantitative methods alone. I wanted to express an old-fashioned respect for context rather than to fall 'head over heels' for Big Data and inference from correlations. Will I learn better? We will see!

Updated: 12/06/2016 to:

New definition:

A process of analysis which produces actionable insights related to teaching and learning (TL) by the application of analytic methods appropriate to their contexts. It is applied to a number of issues important to the design of TL, including environmental and other resources, such as libraries. (updated 12/06/2016)

All the best

Steve

Permalink Add your comment
Share post

This blog might contain posts that are only visible to logged-in users, or where only logged-in users can comment. If you have an account on the system, please log in for full access.

Total visits to this blog: 54914