- Checkpoint
and Process Analytics - what are they?
- Demonstrate
their use.
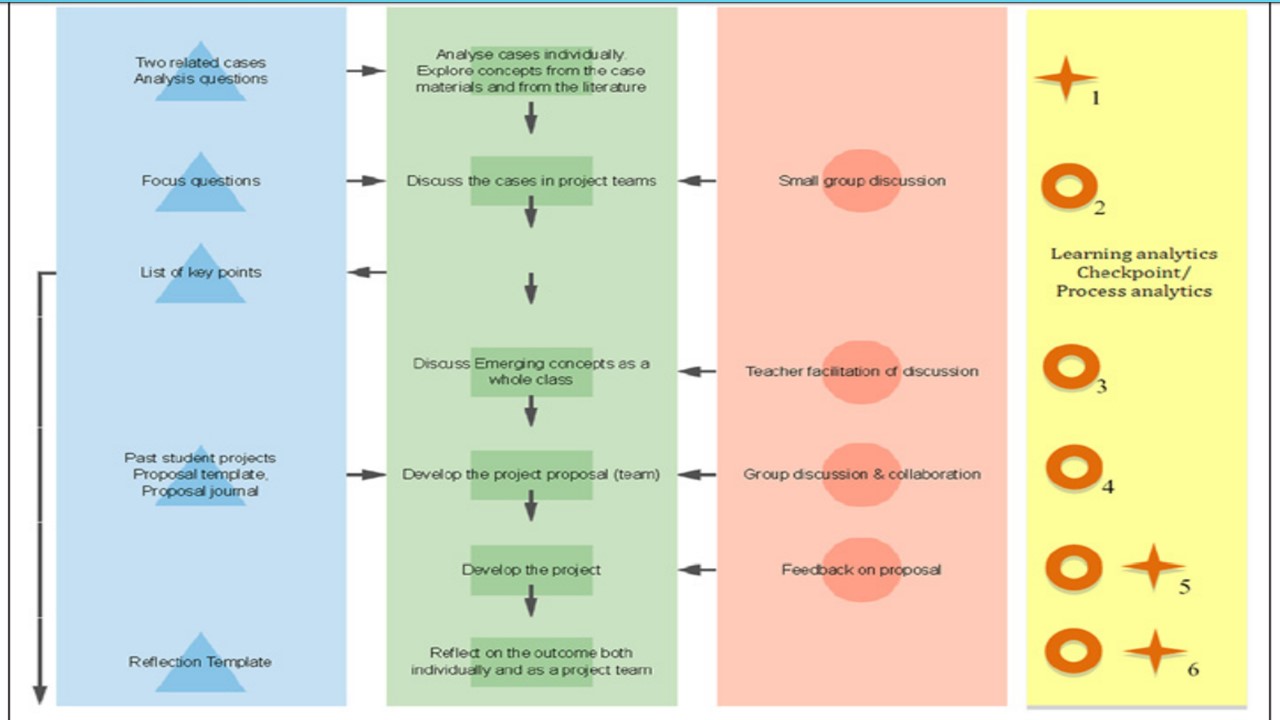
This figure
from Lockyer et. al. (2013, Fig 4:1450, adapted from Bennet 2002) show how a
linear sequence plotted vertically combines elements of learning design used at
each sequential stage of the class or work plan (the stages are numbered in the
yellow column). For each stage options for the use of LA are given to assess
the efficacy of the learning design (Large O is process analytics, star
checkpoint analytics.
The icons in
the columns represent:
Blue triangles
= content or tool used
Green
rectangles = learner activity
Orange
Circles = teacher or peer facilitation
Obviously
this represent only 3 facets of LD but we used a number for Compendium designs
in H800 and the same could be done here. Here the swim-lanes I used in Compendium
are represented by coloured columns. Compendium could be used to create these
models using the icons for each swim lane. This does not differentiate content
from tool, I would.
In in each
line measures can be taken.
1.
Checkpoint analytics count the numbers involved in the process
at this ‘checkpoint’ for comparison with other stages of the sequence, our
expectations, aims or experience from past use of this class design or another.
1.1. Here we collect:
1.1.1. No. 1 – The number of learners given the task (and perhaps the number of
facilitators if any required to do this).
1.1.2. No. 5 – The numbers who receive feedback on their project proposal.
1.1.3. No. 6 - The numbers of those who complete participants involved in thei project
and reflection on it or just the project alone.
2.
Process analytics visualize the stage (coded perhaps by
their type - as facilitator or learner for instance). Tools for producing such visualizations
(Lockyer et. al. 2013:1445) include:
2.1. SNAPP (Social Networks Adapting Pedagogical
Practice) which produces analysis of the social networks in operation at this
stage of the design. These represent participants as the nodes of a network
diagram and can label the links between nodes with a measure of their ‘strength’
relative to each other (no of contacts might be used to represent this
measure). This can show situations such as:
2.1.1.
Peer interactions with equal and shared participation.
2.1.2.
Peer interactions where one (or two) peer (node) dominated the others and
mediates all interactions.
2.1.3.
Peer interactions where one facilitator / teacher (node) dominates the
others and mediates all interactions (teacher-centric stages of a pedagogy).
2.2. LOCO shows how individuals and groups
interact with learning content.
2.3. GLASS shows student and group activity
online for monitoring purposes.
These analytics have immediate face
validity to teachers, learners and learning groups.
Lockyer, L., Heathcote, E. & Dawson, S. G. (2013)
‘Informing Pedagogical Action: Aligning Learning Analytics with Learning Design’
in American Behavioral Scientist 57
(10) 1439 – 1459.

