Use 'Print preview' to check the number of pages and printer settings.
Print functionality varies between browsers.
Printable page generated Thursday 11 September 2025 at 20:04
Maths Skills
Introduction
This activity has been provided to remind you of some mathematical skills which are assumed by the module that you are studying. You may not be required to know everything in this activity in your particular module. We assume that you can add, subtract, multiply and divide whole numbers, and where advanced mathematical skills are required, they will be taught within your module.
You are advised to skim-read the material in this activity, so that you are aware of the ways in which it might help you. Then, if you have difficulty with a mathematical concept in your module, you can refer back to this activity, using the table of contents in the left-hand navigation bar to help you find the relevant section.
When working through a section of this activity, it is particularly important that you try the questions as you go along. You may find it helpful to have some paper and a pen or pencil by your side as you work through the activity, to help you in working out the answers to the questions. The answers (with working) can be accessed by clicking on the ‘Reveal answer’ link below each question. However, please do have a go at the questions yourself before looking at the answers. Practising is the best way to learn new mathematical skills.
Using your scientific calculator
You will need to use a scientific calculator in your module. Unfortunately, different calculators operate in slightly different ways, so this activity cannot provide comprehensive instructions on how to use your calculator. However, at key points where you need to be able to use your calculator for a specific purpose, we have provided some guidelines as to the most likely buttons to use. These guidelines, combined with the manufacturer’s operating instructions, should enable you to use your calculator effectively, and you should check that you can do this when advised to do so. You may wish to use the calculator on your computer. Make sure that you can run it, know how to switch it between ‘standard’ and ‘scientific’ mode, and use it while looking at this material on the screen. Hopefully these examples will help you to see how to use your calculator effectively, for these and other questions you encounter.
If you find that you are not able to use your calculator to get the result given in this activity or other module resources, you should contact your tutor or study adviser as soon as possible.
1 Doing calculations, with or without a calculator
Most science modules assume that you can add, subtract, multiply and divide whole numbers.
Check that you can do this by carrying out the following four calculations without using a calculator:
You should have obtained the following answers:
Now check that you can use your calculator to obtain the same answers as before. You are likely to need to enter the numbers and symbols in a simple sequence from left to right (for example, ‘9’ then ‘+’ then ‘3’) and then to press the ‘=’ key. However, some calculators use the symbol ‘*’ instead of ‘’ for multiplication and ‘/’ instead of ‘’ for division, and at least one model requires users to press ‘Enter’ instead of ‘=’ in order to obtain the answer. Check your calculator now!
Most scientific calculations are rather more complicated than those discussed above, in that they involve several steps. In some of these calculations, for example:
you simply need to start at the left and work through to the right. So in the first example, adding 9 and 3 gives 12, adding another 5 gives 17 and adding another 2 gives the final answer of 19.
Check that you can do the following three calculations both without and with a calculator:
You should have obtained the following answers:
Question 1.1
Use your calculator to find the following:
- a.
- b.
(Note that you do not have to press ‘=’ after the first addition (38 + 92), though if you do the final answer should be the same; check this for yourself.)
- b.
- c.
- d.
- e.
- f.
1.1 Doing calculations in the right order
Consider now the calculation . If you simply work from left to right in this case, adding 3 and 2 gives 5, then multiplying by 4 gives 20, but this is the incorrect answer.
There is a rule, applied by mathematicians and scientists everywhere, which states that:
multiplication and division should be carried out before addition and subtraction.
Applying this rule to the calculation , the multiplication of 2 and 4 should be done first, giving 8, then the 3 is added to give the correct final answer of 11. Most modern calculators ‘know’ this rule (which is known as a rule of precedence, where precedence means ‘priority’), so entering into your calculator in exactly the order in which it is written should give the correct answer of 11. Check this on your calculator now.
Question 1.2
Do the following calculations without using your calculator. Use your calculator to check the answers.
- a.
The multiplication should be done before the addition, so
- b.
The multiplication should be done before the addition, so
(Note that the answers to (a) and (b) are the same. This is because addition and multiplication are individually commutative, i.e. is the same as and 12 + 2 is the same as 2 + 12. Remember though that the multiplication must be done before the addition.)
- c.
The division should be done before the addition, so
- d.
The division and multiplication should be done before the subtraction, so
1.2 What about powers?
Most people are familiar with the fact that can also be written as (said as ‘five squared’) and as 43 (said as ‘four cubed’). This shorthand notation can be extended indefinitely, so becomes (said as ‘two to the power of six’, or more usually as just ‘two to the six’). In this example, the 2 is called the base number and the superscript 6 (indicating the number of twos that have been multiplied together) is variously called the power, the exponent or the index (plural indices).
Use your calculator’s instruction booklet or your computer calculator’s help system to find out how to enter a base number raised to a power, such as .
You may have a button labelled ‘’, in which case you should press ‘2’ then ‘’ then ‘6’. Alternatively you may have a button labelled ‘^’ in which case you should press ‘2’ then ‘^’ then ‘6’. In both cases you probably need to then press ‘=’ or ‘Enter’.
If you are asked to calculate, say, , another rule of precedence tells you that:
powers should be calculated before multiplication, division, addition or subtraction.
So, in the example of , the should be evaluated (worked out) first.
so
Question 1.3
Do the following calculations without using your calculator. Use your calculator to check the answers.
- a.
- b.
The should be evaluated first, and
Then
- c.
The and should be evaluated first.
and
Then
- d.
The and should be evaluated first.
and
Then
1.3 The role of brackets
Sometimes, you need to do the addition or subtraction in a calculation before the multiplication, or to add two numbers together before raising to a power. The way to over-ride the standard rules of ‘multiplication before addition’ and ‘powers before multiplication’, etc., is to use brackets:
Brackets in a calculation mean ‘do this first’.
So, in the calculation , you should add the 3 and the 2 first (to give 5), then multiply by 4, i.e. Similarly, in the calculation , you should add the 3 and the 4 first before squaring. So
You can do calculations including brackets on a scientific calculator by making use of its brackets keys, usually labelled as ‘(’ and ‘)’. Try the calculation on your calculator now.
If you have a calculation which involves nested brackets, work out the innermost sets first. For example:
Note that using different symbols for the brackets, for example ( ), { } and [ ], makes the calculation clearer than using the same symbol throughout the calculation.
Strictly speaking, brackets are only needed to override the other rules of precedence, and they are not needed in calculations such as . In the absence of the brackets, you or your calculator would follow the rule and do the multiplication first in any case. However, brackets are often used in calculations for clarity, even when they are not strictly necessary. For example, the calculation is more understandable and ‘readable’ if it is written as , even though the brackets are not essential here. You are encouraged to write brackets in your calculations whenever they help you to express your working more clearly.
1.4 BEDMAS
Fortunately, there is an easy way to remember the correct order in which arithmetic operations should be carried out. The rules are neatly summed up in the mnemonic BEDMAS. The letters in BEDMAS stand for Brackets, Exponents, Division, Multiplication, Addition and Subtraction, and the order of the letters gives the order in which the operations should be carried out. In other words, you should work out the brackets first, then the exponents (otherwise known as indices or powers), then any divisions and multiplications, and finally the additions and subtractions. You may see BIDMAS (where the ‘I’ stands for ‘Indices’) or BODMAS written instead of BEDMAS; the three expressions are equivalent.
There is one final point to make about the order in which arithmetic should be done. When faced with a calculation that includes a series of multiplications and divisions (or a series of additions and subtractions), then you should work through the calculation from left to right in the order in which it is written.
Question 1.4
To practise the BEDMAS rules, try the following calculations both in your head and with your calculator.
- a.
Working from left to right gives
- b.
The multiplication should be done before the addition, so
- c.
The bracket should be evaluated first, so
- d.
The multiplication should be done before the subtraction, so
- e.
The bracket should be evaluated first, so
- f.
Working from left to right gives
- g.
The bracket should be evaluated first, so
- h.
The bracket should be evaluated first, so
- i.
The term including an exponent, 32, should be evaluated first, so
- j.
The innermost brackets should be evaluated first, so
1.5 Alternative ways of writing calculations
So far in this activity, the four arithmetic operations have been written as , –, and . However, in scientific calculations, division is more usually written as a fraction (see Section 3.1 for more about fractions). Twelve divided by three could equally accurately be written as or
Or, to give a slightly more complicated example, could equally accurately be written as or as
Note that the bracket, used to indicate that the addition should be done before the division in this case, has been omitted from the final statement of this expression. This is because the horizontal line used to indicate division acts as an ‘invisible bracket’, i.e.
Other mathematical symbols can act as ‘invisible brackets’. The most commonly used one is the square root sign . Finding the square root of a number is the opposite of finding the square. So, since (said as ‘three squared’) is 9, (said as ‘the square root of 9’) is 3 (strictly, the square root of 9 could also be the negative number -3, but this activity will only consider positive square roots). If you are asked to calculate , the fact that the upper line of the square root sign extends to include the whole of the addition means that the addition should be done first, i.e. Note that this is rather different from , in which the square root sign only extends over the 9, so
Provided the meaning is clear without it, the multiplication sign is also sometimes omitted from calculations. So could be written as and could be written as
Question 1.5
Evaluate (i.e. calculate the value of) the following, with or without your calculator:
- a.
- b.
- c.
- d.
- e.
- f.
- g.
means , so
- h.
means , so
1.6 Checking your answer
Unfortunately, it is possible to get the wrong answer when using a calculator. This is not an indication of the unreliability of modern electronic technology; it’s an indication that a calculator is only as good as the fingers that press the keys! It is easy to press the wrong key, or to press keys in the wrong order, and hence to end up with a meaningless answer. It is therefore good practice to check the numbers that appear in the display as you key them in, and to repeat a calculation if the answer seems suspicious. This begs the question of how you know if the answer looks suspicious.
There are a few simple things to look out for: when adding positive numbers, the answer should be bigger than the largest of the numbers you are adding; and when subtracting one positive number from another the answer should be smaller than the larger of the two numbers. When you multiply two positive numbers, each larger than 1, the result should be larger than either of the numbers, and dividing one positive number by another that is larger than 1 should produce a result that is less than the first number.
In addition, it is good practice to estimate the answer to a question using simpler numbers. For example, you could estimate the answer to by working out (in your head) , which is 2. You would expect the answer to to be fairly close to the estimated answer.
2 Negative numbers
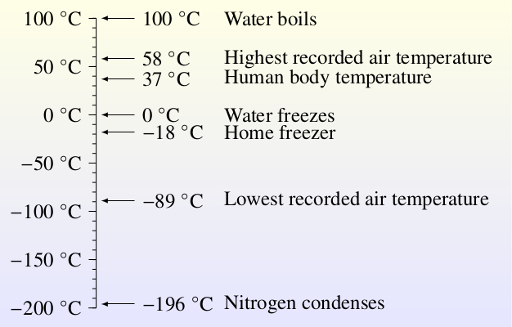
Negative numbers arise in any situation in which we need to talk about numbers that are less than some agreed reference point (labelled zero). For example, on the Celsius temperature scale, the reference point 0 °C (said as ‘zero degrees Celsius’) is the temperature at which pure water freezes under normal atmospheric conditions. When the temperature falls five degrees below 0 °C, then we say that it is minus five degrees Celsius, or -5 °C, and if it falls even further to ten degrees below zero then it is -10 °C. So the minus sign in front of a temperature tells you that it is ‘less than zero’ and the number tells you how many degrees less than zero. In other words, the larger the number that follows the minus sign, the further the temperature is below zero degrees.
Mathematically, five degrees below zero means 0 °C - 5 °C, and if you do this subtraction the answer is -5 °C.
If you are not used to thinking about negative numbers, then it may help to think in terms of money. If your account is overdrawn by £50, then it has ‘£50 less than nothing’ in it, and your balance is -£50. You would have to add £50 to bring the balance up to zero. In a similar way, if the temperature is -50 °C (i.e. 50 °C ‘less than nothing’), then you would have to increase the temperature by 50 °C to bring it up to zero.
A wide range of Celsius temperatures is shown in Figure 2.1. The highest temperature marked is that of boiling water. When temperatures fall below zero, they are represented by negative numbers; the lower the temperature, the larger the number following the minus. At the lowest temperature shown, -196 °C (i.e. 196 degrees Celsius below zero), nitrogen gas, which is the main component of the air we breathe, condenses and becomes a liquid.
Question 2.1
In each of the following pairs of temperatures, which value would correspond to the warmer object?
- a.57 °C and 65 °C
65 °C
- b.57 °C and -65 °C
57 °C
- c.-57 °C and -65 °C
-57 °C
- d.-57 °C and 65 °C
65 °C
Question 2.2
Arrange the following temperatures in increasing order, i.e. starting with the lowest temperature and ending with the highest temperature:
210 °C, 0 °C, -27 °C, 1 750 °C, -85 °C, -26 °C, -210 °C, 85 °C
-210 °C, -85 °C, -27 °C, -26 °C, 0 °C, 85 °C, 210 °C, 1 750 °C
2.1 Calculating with negative numbers
You may be required to perform arithmetic operations (addition, subtraction, multiplication and division) involving negative numbers. There are good reasons why negative numbers should be handled in the way that they are, but these reasons can be quite difficult to understand. This activity simply gives a series of rules to apply, with examples of each.
Adding a negative number is the same as subtracting the corresponding positive number.
So, for example:
Subtracting a negative number is the same as adding the corresponding positive number.
So, for example:
Note the way in which brackets have been used in the examples to make it clear how the numbers and signs are associated. If you are struggling to see why subtracting 3 from -5 should give -8, whereas adding 3 to -5 gives -2, you may find it helpful to revisit the financial analogy. If your account is £5 overdrawn and you spend a further £3, you will end up with an overdraft of £8. However, if your account is £5 overdrawn and you repay £3, your overdraft will be reduced to £2.
If you multiply or divide two numbers which have the same sign, the answer is positive.
So, , as you already know, but also
, as you already know, but also
If you multiply or divide two numbers which have different signs, the answer is negative.
So and
Question 2.3
Do the following calculations, without using your calculator.
- a.
- b.
- c.
- d.
Make sure that you know how to input negative numbers into your own calculator. With some calculators you will be able to enter expressions like those in Question 2.3 more or less as they are written, with or without brackets. With other calculators you may need to use a key labelled as +/- or in order to change a positive number into a negative one.
Question 2.4
Making sure that you input all the signs, use your calculator to work out the following:
- a.
- b.
- c.
3 Fractions, ratios and percentages
Fractions, ratios and percentages are all ways of expressing proportions, i.e. they show the relationship between two or more numbers.
3.1 Fractions
The term ‘fraction’ means that a quantity is part of a whole, and is the result of dividing a whole amount into a number of equal parts. So, if you say that you can eat one-quarter of a pie, written as , then you are dividing the pie into four equal parts and saying that you can eat one of those parts. After you take your of the pie, three of the four quarters will remain, so the fraction remaining is three-quarters or . The numbers and are examples of fractions.
Fractions can be written in two different ways: three-quarters can be written as or 3/4. Both forms will be used in this activity. The first is used when writing out a calculation, but the second way is sometimes more convenient in a line of text.
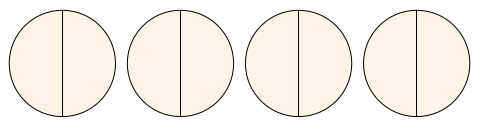
Any fraction can be expressed in a variety of equivalent forms. Thus, two-quarters of a fruit pie, 2/4, means two of the four equal parts, and you know that this is the same amount as one half, 1/2. So 2/4 and 1/2 are said to be equivalent fractions because they are of equal value. Figure 3.1 shows four rectangular blocks of chocolate, of identical sizes, but divided into different numbers of equal-sized pieces. The darker areas can be expressed as different fractions, but all of the darker areas are the same size, so the four fractions are all equivalent. This means that:
In words, we would say ‘three-eighths equals six-sixteenths equals nine-twenty-fourths equals fifteen-fortieths’. Or an alternative way of saying this would be ‘three over eight equals six over sixteen equals nine over twenty-four equals fifteen over forty’.
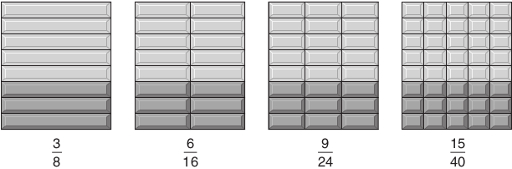
Note that you can change 3/8 to the equivalent fraction 6/16 by multiplying both the number on the top and the number on the bottom by 2. Similarly, you can convert 3/8 to 9/24 by multiplying both the top and the bottom by 3.
By what number do you have to multiply both the top and the bottom of the fraction 3/8 to end up with 15/40?
5, because , and .
If you take any fraction, and multiply both the number on the top of the fraction and the number on the bottom by the same number – any one you care to choose – you will produce an equivalent fraction. Thus:
Here we have multiplied the top and the bottom of the fraction in turn by 2 (to get ), then by another 2, then by 5, and finally by 10.
Fractions are usually expressed with the smallest possible whole numbers on the top and the bottom. Working out the equivalent fraction with these smallest numbers is really a matter of finding numbers that can be divided into both the number on the top of the fraction and the number on the bottom. For example,
so these are all equivalent fractions.
Here we first divided the numbers on the top and the bottom of the first fraction by 10 to get , then we divided both numbers by 2 to get , and finally by 3 to end up with .
Note that all four of these fractions are equivalent, but we would normally use the fraction with the lowest numbers, .
Working out an equivalent fraction with the smallest whole numbers can be done step by step, as in the example above. It’s best to start by seeing if you can divide by simple numbers, like 10, 2, 5. Thus, if the numbers on the top and the bottom of a fraction both end in zero, then you can divide them both by 10 (first step in the example above). If they are both even numbers, then you can divide them by 2 (second step above). If both end in either a five or a zero, then they can be divided by five.
So, to express with the smallest whole numbers, you would divide the top and the bottom by 10. This division can be illustrated by ‘cancelling out’ the zeros by crossing them through with a diagonal line:
This cancelling process is the same as dividing – in this case dividing by 10. If there are more zeros, then more cancelling is possible. Thus:
How would the fractions and normally be expressed?
In the first case, we have divided in turn by 10, by 5 and by 3; in the second case, we have divided by 10, then 2 and then 3.
Until now, we have only considered fractions for which the number on the top is smaller than the number on the bottom, so these fractions are part of a whole. However, it is possible to have a fraction in which the number on the top is larger than the number on the bottom, such as or , and these are sometimes called ‘improper fractions’. The fraction simply means five-quarters (of a pie, or whatever); only four-quarters can come from a whole pie, so the fifth quarter must come from another pie.
Question 3.1
Which of the following are equivalent fractions?
and are all equivalent fractions; they can all be reduced to .
and are not equivalent to the other fractions or to each other; they have different values.
3.2 Ratios
Looking again at the chocolate bars in Figure 3.1, you can see that 3 out of 8 pieces are darkened in the first, 6 out of 16 in the second, 9 out of 24 in the third and 15 out of 40 in the fourth. These pairs of numbers, which form equivalent fractions, are said to be in the same ratio. So any pairs of numbers that form equivalent fractions are in the same ratio.
Which of the following pairs of numbers are in the same ratio as (6, 20)?
6/20 = 3/10 = 12/40 = 30/100, so these are all equivalent fractions, and therefore the pairs of numbers from which they are formed are in the same ratio. Using the lowest whole numbers, we say that these pairs of numbers are all in the ratio 3 to 10. The fractions 12/30 (= 6/15) and 24/100 (= 6/25) are not equivalent to 6/20, so (12, 30) and (24, 100) are not in the same ratio as (6, 20).
Ratios are often written as two numbers separated by a colon (:). So, a fraction such as 3/10 is equivalent to a ratio of 3 to 10 and this is often written as 3 : 10.
You need to take care when asked to give the ratio of two numbers, as the following example shows.
Suppose 2 out of 10 people in the UK drink bottled water. What is the ratio of people who drink bottled water to those who don’t?
The ratio is 2 : 8.
Did you fall into the trap and answer 2 : 10? This is the ratio of people who drink bottled water to the total number of people. Of course if we’d asked what is the ratio of people who don’t drink bottled water to those who do, the answer would have been 8 : 2. So, always read the question carefully!
Ratios are particularly useful where the relative proportions of two or more parts of a whole are being considered. For example, the ratio of males to females in the general population of the UK is about 1 : 1.
Question 3.2
In a random group of students, 15 were men and 8 were women.
a.What was the ratio of women to men in the group?
The ratio of women to men in the group is 8 : 15.
b.What fraction of the total group were women?
The total number of students is , so of the group are women.
It is sometimes helpful to express a ratio in the simplest possible form, so the ratio 2 : 8 would be expressed as 1 : 4 (dividing each number by 2) and the ratio 60 : 40 would be expressed as 3 : 2 (dividing each number by 20).
Express the ratio 25 : 20 in the simplest possible form involving whole numbers.
25 : 20 is the same as 5 : 4 (dividing both numbers by 5).
In addition, you may sometimes be required to express a ratio as ‘something : 1’, where the ‘something’ is no longer necessarily a whole number. To convert a ratio to the ‘something : 1’ form, divide both numbers by the number on the right hand side of the ratio, so 3 : 2 becomes 1.5 : 1 and 1 : 4 becomes 0.25 : 1.
Express the ratio 5 : 4 in the form ‘something : 1’.
5 : 4 is the same as 1.25 : 1 (dividing both numbers by 4).
Express the ratio 365 : 20 in the form X : 1 where X is rounded to the nearest whole number.
365 : 20 is the same as 18.25 : 1 (dividing both numbers by 20). When rounded to the nearest whole number this gives a ratio of 18 : 1.
3.3 Percentages
You have probably met percentages in various contexts, such as a 3% pay rise, 10% interest on a loan, or 20% off goods in a sale. A percentage is a fraction expressed in hundredths. So 1/2, i.e. one-half, is 50/100, or fifty-hundredths, and we say that this is 50 per cent, which is usually written as 50%. This literally means 50 in every 100. The advantage of using percentages is that we are always talking about hundredths, so percentages are easy to compare, whereas with fractions we can divide the whole thing into arbitrary numbers of parts, eighths, sixteenths, fiftieths, or whatever we choose. It is not immediately obvious that 19/25 is larger than 15/20, but if these fractions are expressed as percentages, i.e. 76% and 75%, respectively, then it is easy to see that the former number is the larger of the two. But how do we convert fractions to percentages, or percentages to fractions?
The way that you convert a fraction into a percentage is by multiplying the fraction by 100%. So to convert 1/2 to a percentage:
Three-quarters, 3/4, converts to:
On occasions, you will need to convert a percentage to a fraction, and to do this you need to remember that a percentage is a fraction expressed in hundredths and then cancel as appropriate.
Thus,
(having divided the top and the bottom of the fraction by 5, then by 5 again),
and
(having divided the top and the bottom by 5).
Question 3.3
Convert the following fractions to percentages:
- a.
70%
(Remember, to convert a fraction to a percentage you multiply it by 100%; so
is equivalent to )
- b.
45%
- c.
52%
- d.
63%
- e.
70%
- f.
150%
{Note that this last answer is greater than 100%, because the fraction (or ) is greater than 1.}
Question 3.4
Convert the following percentages to fractions with the smallest possible whole numbers on the top and the bottom:
- a.60%
(Here, we have first divided the top and bottom of the sixty-hundredths by 10, and then by 2. Remember that dividing (or multiplying) both the top and bottom of a fraction by any number will produce an equivalent fraction. It is conventional to express fractions with the smallest possible numbers on the top and bottom.)
- b.64%
(Here we have divided the top and the bottom of by 2 and then 2 again, which is the same as dividing by 4.)
- c.65%
- d.67%
(This time, there are no whole numbers by which we can divide both 67 and 100 to produce smaller whole numbers on the top and bottom.)
3.4 Calculating fractions and percentages of numbers
Finally, let’s consider how you would work out what , or 75%, of 36 is.
First think about what of 36 means. It means divide 36 into 4 equal parts or quarters .
Then, since we want three-quarters, which is three times as big, we multiply one of these parts by three .
So of 36 is 27.
We can write this calculation as , which means the same thing as , or
So ‘ of’ a number means multiply that number by
What is of 18?
Working out 75% of a number can be done in a similar way if you remember that So 75% of 40 is:
Some calculators will convert directly between fractions and percentages and find the percentage of a number at the press of a button. However, it is worth making sure that you understand the meaning of fractions and percentages before letting your calculator do the work for you. This will enable you to check that the answer you obtain is reasonable, for example, 48% of a quantity should be just less than half of it.
In summary, you can see that fractions, ratios and percentages are all ways of expressing a proportion. So, for example, if you eat of a pie, the ratio of the amount you eat to the total pie is 1 : 4, and the percentage that you eat is 25%.
Question 3.5
Work out:
- a. of 20
- b. of 24
- c.15% of 60
15% of 60 is
- d.60% of 5
60% of 5 is
3.5 Doing calculations with fractions
3.5.1 Adding and subtracting fractions
Suppose we want to add the two fractions shown below:
We cannot just add the 3 and the 2. The 3 represents 3 quarters and the 2 represents 2 fifths, so adding the 3 to the 2 would be like trying to add 3 apples and 2 penguins – you just can’t do it!
In order to add or subtract two fractions, it is necessary for them both to have the same denominator (bottom line).
Fractions with the same denominator are said to have a ‘common denominator’. One way to find a common denominator when adding or subtracting two fractions is to multiply the top and bottom of the first fraction by the denominator of the second fraction, and the top and bottom of the second fraction by the denominator of the first fraction. A return to our example may make this clearer:
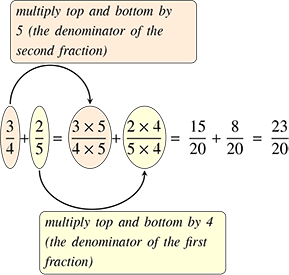
Note that the and are equivalent fractions (Section 3.1) as are and , and that and can be added without difficulty because they have a common denominator of 20.
Question 3.6
Work out the following, leaving each answer as the simplest possible fraction:
- a.

- b.
3.5.2 Multiplying fractions
The expression ‘three times two’ just means there are three lots of two (i.e. 2 + 2 + 2). So multiplying by a whole number is just a form of repeated addition. For example,
This is equally true if you are multiplying a fraction by a whole number:
We could write the 3 in the form of its equivalent fraction and it is then clear that the same answer is obtained by multiplying the two numerators together and the two denominators together:
In fact, this procedure holds good for any two fractions.
To multiply two or more fractions, multiply numerators (top lines) together and also multiply the denominators (bottom lines) together.
So
Sometimes cancelling is possible:
3.5.3 Dividing fractions
The meaning of an expression such as is not immediately obvious, but a comparison with a more familiar expression, say may help. asks us to work out how many twos there are in 6 (the answer is 3). In exactly the same way, asks how many halves there are in 4. Figure 3.2 illustrates this in terms of circles. Each circle contains two half-circles, and 4 circles therefore contain 8 half-circles. So
This can be extended into a general rule:
To divide by a fraction, turn it upside down and multiply.
So
And
Finally, remembering that 3 can be written as
Question 3.7
Work out the following, leaving each answer as the simplest possible fraction:
- a.
- b.
- c.
4 Decimal numbers and decimal places
We introduced fractions in the previous section, and a fraction like can also be written as 0.5. So , 50% and 0.5 all mean the same thing and the number 0.5 is an example of a decimal number. Decimal numbers are important as calculators use them in any calculation involving not just whole numbers. They are used throughout science, and you need to become proficient at adding, subtracting, multiplying and dividing decimal numbers. Fortunately, your calculator will take the pain out of the calculations, so you can concentrate on understanding what the numbers mean.
Decimal numbers consist of two parts separated by what is called a decimal point. When printed, a ‘full stop’ is used for the decimal point. Here are four examples, with words in brackets indicating how you say the numbers: 0.5 (‘nought point five’), 2.34 (‘two point three four’), 45.875 (‘forty-five point eight seven five’) and 234.76 (‘two hundred and thirty-four point seven six’). Note that the part of the number before the decimal point is spoken as a whole number, and the part after the point is spoken as a series of individual digits. It’s also worth noting that in parts of Europe outside the UK, a comma is used instead of a full stop in decimal numbers.
What do these numbers mean? Well, the part of the number before the decimal point represents a whole number, and the part after the decimal point represents the fraction, something between nought and one, that has to be added on to the whole number. Thus if you divide 13 by 2 you get if you use fractions, but 6.5 if you use a calculator; the 0.5 is equivalent to the half. Note that when there is no whole number, i.e. the number is less than one, it is usual to print or write a zero in front of the decimal point, otherwise the decimal point might be overlooked. (Your calculator, however, may not always show the zero.) If you divide 13 by 4, then with fractions you get and with a calculator you get 3.25, so a quarter is the same as 0.25.
Conversion of any fraction to a decimal number is straightforward with a calculator. All you have to do is divide the number on the top of the fraction by the number on the bottom. Try this for yourself: with the fraction , you should obtain the decimal number 0.375.
Now just as each digit that comes to the left of the decimal point has a precise meaning that depends on where it comes in the order, so also does each digit that comes after the decimal point. These meanings are summarised in Table 4.1 for the number 7 654.321.
| Thousands | Hundreds | Tens | Units | Point | Tenths | Hundredths | Thousandths |
|---|---|---|---|---|---|---|---|
| 7 | 6 | 5 | 4 | . | 3 | 2 | 1 |
| = 7 000 | = 600 | = 50 | = 4 | = 0.3 | = 0.02 | =0.001 | |
| total = 7 654 | total = 0.321 | ||||||
The 4 immediately before the decimal point means 4 units (or 4 ones), which is simply 4; the 5 signifies 5 tens, or 50; the 6 signifies 6 hundreds, or 600; and the 7 signifies 7 thousands, or 7 000. So 7 654 means 7 000 + 600 + 50 + 4.
In a similar way, the 3 after the decimal point means 3 tenths, or , the 2 means 2 hundredths, or , and the 1 means 1 thousandth, or . And, just as 7 654 means 7 thousands plus 6 hundreds plus 5 tens plus 4 units, so 0.321 means 3 tenths plus 2 hundredths plus 1 thousandth. So
Now, to add fractions, we first have to convert them to equivalent fractions with the same number on the bottom. In this case, we shall convert the first two fractions to equivalent fractions with 1 000 on the bottom.
Since is an equivalent fraction to , and is equivalent to , then
Here, we have added the numbers on the tops of the fractions together to get the total number of ‘thousandths’, but we don’t add the numbers on the bottoms of the fractions since these just tell us that we are adding ‘thousandths’ in each case.
This shows that converting a decimal number to a fraction is really quite straightforward; you just take the numbers after the decimal point (321 in the example above) and divide by 1 followed by the same number of zeros as there were digits after the decimal point (three in this case), so
Question 4.1
Convert the following fractions to decimal numbers:
- a.
You can convert the fraction to the equivalent decimal number by dividing the number on the top of the fraction by the number on the bottom.
- b.
You can convert the fraction to the equivalent decimal number by dividing the number on the top of the fraction by the number on the bottom.
- c.
You can convert the fraction to the equivalent decimal number by dividing the number on the top of the fraction by the number on the bottom.
- d.
You can convert the fraction to the equivalent decimal number by dividing the number on the top of the fraction by the number on the bottom.
This highlights the fact that the first number after the decimal point tells us the ‘number of tenths’.
- e.
You can convert the fraction to the equivalent decimal number by dividing the number on the top of the fraction by the number on the bottom.
This highlights the fact that the first number after the decimal point tells us the ‘number of tenths’.
- f.
You can convert the fraction to the equivalent decimal number by dividing the number on the top of the fraction by the number on the bottom.
This highlights the fact that the first number after the decimal point tells us the ‘number of tenths’.
- g.
You can convert the fraction to the equivalent decimal number by dividing the number on the top of the fraction by the number on the bottom.
This highlights the fact that the second number after the decimal point tells us the ‘number of hundredths’.
- h.
You can convert the fraction to the equivalent decimal number by dividing the number on the top of the fraction by the number on the bottom.
This highlights the fact that the second number after the decimal point tells us the ‘number of hundredths’.
- i.
You can convert the fraction to the equivalent decimal number by dividing the number on the top of the fraction by the number on the bottom.
This highlights the fact that the second number after the decimal point tells us the ‘number of hundredths’.
- j.
You can convert the fraction to the equivalent decimal number by dividing the number on the top of the fraction by the number on the bottom.
Question 4.2
Convert the following decimal numbers to fractions, and convert each fraction to the smallest whole number on the top and the bottom:
- a.0.7
To convert a decimal number between 0 and 1 to a fraction, you write the digits that follow the decimal point on the top of the fraction, and on the bottom of the fraction you write a 1 followed by the same number of zeros as there are digits following the decimal point. So for 0.7, you write 7 on the top of the fraction, and 10 on the bottom – one zero on the bottom because there is one digit on the top of the fraction.
- b.0.8
To convert a decimal number between 0 and 1 to a fraction, you write the digits that follow the decimal point on the top of the fraction, and on the bottom of the fraction you write a 1 followed by the same number of zeros as there are digits following the decimal point. So for 0.8, you write 8 on the top of the fraction, and 10 on the bottom – one zero on the bottom because there is one digit on the top of the fraction. Both these numbers are divisible by two, so the fraction can be simplified.
- c.0.2
To convert a decimal number between 0 and 1 to a fraction, you write the digits that follow the decimal point on the top of the fraction, and on the bottom of the fraction you write a 1 followed by the same number of zeros as there are digits following the decimal point. So for 0.2, you write 2 on the top of the fraction, and 10 on the bottom – one zero on the bottom because there is one digit on the top of the fraction. Both these numbers are divisible by two, so the fraction can be simplified.
- d.0.22
To convert a decimal number between 0 and 1 to a fraction, you write the digits that follow the decimal point on the top of the fraction, and on the bottom of the fraction you write a 1 followed by the same number of zeros as there are digits following the decimal point. So for 0.22, you write 22 on the top of the fraction, and 100 on the bottom – two zeros on the bottom because there are two digits on the top of the fraction. Both these numbers are divisible by two, so the fraction can be simplified.
- e.0.222
To convert a decimal number between 0 and 1 to a fraction, you write the digits that follow the decimal point on the top of the fraction, and on the bottom of the fraction you write a 1 followed by the same number of zeros as there are digits following the decimal point. So for 0.222, you write 222 on the top of the fraction, and 1 000 on the bottom – three zeros on the bottom because there are three digits on the top of the fraction. Both these numbers are divisible by two, so the fraction can be simplified.
Question 4.3
Convert the following percentages to decimal numbers:
- a.79%
- b.35%
- c.3%
(Hint: you may find it helpful to start by converting the percentages to fractions, as discussed in Section 3.)
A calculator does arithmetic with decimal numbers in the same way as it does with whole numbers, including carrying out operations in the right order. The only difference is that you have to key in the decimal point, using the decimal point key on the calculator, at the appropriate place in decimal numbers.
As an example, try multiplying 2.36 and 43.7. The result, 103.132, should appear in the display.
Question 4.4
Work out the following decimal calculations:
- a.
- b.
- c.
- d.
4.1 Decimal places and rounding
So far in this section, you have met decimal numbers with one, two or three digits after the decimal point. The number of digits after the decimal point is termed the number of places of decimals. For example, we say that the number 1.735 is expressed to three decimal places. 7 is in the first decimal place, 3 in the second decimal place and so on.
Now often when you do a calculation your calculator will display an answer with perhaps 7 decimal places – for example, it will indicate that is 0.333 333 3. (Note the convention of leaving a gap after every third digit after the decimal point in the same way that a gap is left every third digit before the decimal point, counting from the decimal point in each direction.) In most cases, it is not necessary to give all of these digits. We might be happy to know that is about 0.33, and to forget about the thousandths and the ten-thousandths and so on. Or sometimes it is enough to know that is about 0.3. If we approximate in this way, we say that we are rounding the number. But rounding is a bit more complicated than just chopping off the unwanted digits.
If we wanted to round 1.264 5 to two decimal places, we would need to look at the first digit to be removed – 4 in this case. If the first digit removed is a 0, 1, 2, 3 or 4, then the last remaining digit – 6 in this case – is left unchanged. So the answer would be 1.26.
However, if the first of the digits that are removed is a 5, 6, 7, 8 or 9, then the last remaining digit is increased by one. So, for example, if 1.264 5 is rounded to one decimal place, the answer is 1.3 – the 2 is rounded up to 3 because the first digit removed was 6.
The reason for rounding up when the first digit removed is 5 or greater is clear if you bear in mind that the number that is midway between 1.2 and 1.3 is 1.25. So all numbers between 1.25 and 1.3 are closer to 1.3 than they are to 1.2. It therefore makes sense to round up the last remaining digit whenever it has been followed by a digit between 5 and 9. Note that by convention, the digit 5 is rounded up.
Sometimes, rounding a decimal number will produce a zero as the final digit; for example, both 1.803 and 1.798 become 1.80 when rounded to two decimal places. Don’t be tempted to ignore the final zero in these cases though, because it contains important information about the decimal number. Quoting a length as 1.80 metres tells you that the measurement is between 1.795 0 metres and 1.804 9 metres because numbers within this range are equal to 1.80 metres when rounded to two decimal places. Quoting the length as 1.8 metres, on the other hand, means that it is between 1.750 metres and 1.849 metres, which is a much larger range.
Question 4.5
Round each of the following numbers to one decimal place, to two decimal places and to three decimal places:
- a.0.264 8
0.3 to one decimal place; 0.26 to two decimal places; 0.265 to three decimal places.
- b.0.825 51
0.8 to one decimal place; 0.83 to two decimal places; 0.826 to three decimal places.
- c.21.118 4
21.1 to one decimal place; 21.12 to two decimal places; 21.118 to three decimal places.
5 Units of measurement

If you were told that the length of a piece of string was 37, you would be rather baffled. 37 what? Is it 37 metres, 37 centimetres, 37 feet, or even 37 miles? Similarly, if somebody says that a friend weighs 100, what does this mean? These examples highlight the importance of having defined units with which to make measurements and the importance of quoting the units when you want to communicate what you have measured.
In science, the units used are known as SI units, which is an abbreviation for ‘Système Internationale d’Unités’ (International System of Units). In 1960, an international conference formally approved this set of metric units as standard, so replacing the many different national systems of measurement that had been used in science up to that time. The advantage of having a standard set of units is that everyone uses them, and there is no need to convert laboriously from one system to another to compare results in different countries. So although in everyday life in the UK people may still buy milk and beer in pints, and measure distances between towns in miles, in the scientific community SI units are used almost exclusively.
So what are these units? At this stage, we shall just introduce the SI units of length, time and mass.
- The basic SI unit of length is the metre, which is abbreviated to m.
- The basic SI unit of time is the second, which is abbreviated to s.
- The basic SI unit of mass is the kilogram, which is abbreviated to kg.
Although a metre is a conveniently sized unit for measuring the height of a person or the width of a room, it is the wrong sort of size to use for quoting the distance between London and Edinburgh, or the breadth of a pinhead. It is therefore conventional and convenient to use larger and smaller multiples of the metre when appropriate; note that these are also SI units. So, for example, large distances can be measured in kilometres (km), and small distances or lengths can be measured in millimetres (mm). The prefix kilo means ‘one thousand’, so a kilometre is one thousand metres. The prefix milli means ‘one-thousandth’, so a millimetre is one-thousandth of a metre. Put another way, one metre is one thousand millimetres. Therefore, 1 km = 1 000 m, 1 mm = m and 1 m = 1 000 mm.
How many millimetres are there in 1 kilometre?
1 km = 1 000 m and 1 m = 1 000 mm,
so 1 km = 1 000 1 000 mm = 1 000 000 mm.
Another common prefix that you may have met is centi (as in centimetre, abbreviated to cm), which means ‘one-hundredth’. So 1 cm = m, and this means that:
100 cm = 100 m = m = 1 m, i.e. 1 m = 100 cm.
How many centimetres are there in 25 metres?
Since 1 m = 100 cm, 25 m = 25 100 cm = 2 500 cm.
If you didn’t know how many millimetres there were in a centimetre, you could use the definitions to work this out. From the definitions,
1 m = 100 cm = 1 000 mm
So if we divide each of these equal lengths by 100, then
m = cm = mm
which gives
m = 1 cm = 10 mm
This means that there are 10 millimetres in 1 centimetre. Alternatively, if you want to know how many centimetres are equivalent to 1 millimetre, you can start from the equation 1 cm = 10 mm and divide these equal lengths by ten, so cm = 1 mm, or 1 mm = cm.
How many centimetres are there in 350 millimetres?
Each millimetre is equal to cm, so we need to multiply the number of millimetres (350) by cm. So 350 mm = 350 cm = cm = 35 cm.
In general, we use the abbreviations for units in all calculations, like the ones above. Within the main text, we sometimes use the full word and sometimes the abbreviation, though as the module progresses we shall use the abbreviations more frequently. Most importantly, you can also see from these examples that the abbreviations for units are both singular and plural, so ‘m’ means metre or metres.
The relationships between the four units of length that have been introduced are summarised in Table 5.1.
| 1 km | = | 1 000 m | = | 100 000 cm | = | 1 000 000 mm |
| km | = | 1 m | = | 100 cm | = | 1 000 mm |
| km | = | m | = | 1 cm | = | 10 mm |
| km | = | m | = | cm | = | 1 mm |
The basic SI unit of time, the second (s), will be familiar from everyday life. Longer time intervals may be measured in minutes, hours, days or years, but these are not SI units. Shorter times are measured in smaller multiples (or sub-multiples) of the second. Thus, a millisecond (ms) is one-thousandth of a second, just as a millimetre is one-thousandth of a metre.
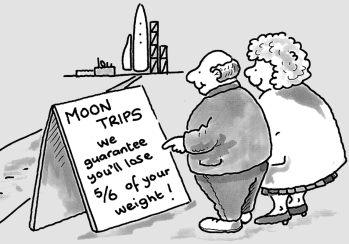
You may have been surprised that we said that the kilogram is the SI unit for mass, rather than the unit for weight. After all, in everyday usage we talk about somebody’s weight being so many kilograms. However, in scientific use, the term weight means the downward pull on an object due to gravity, for example, the downward pull that makes an apple fall to the ground. This means that your weight would decrease if you went to the Moon, where gravity is only about 1/6 as strong as on Earth. Your mass, however, is determined by the amount of matter in your body, and, since this doesn’t depend on gravity, your mass is the same wherever you are in the Universe. Weighing scales are always marked in units of mass, for example, kilograms, so to be scientifically correct you should say that somebody has a mass of 55 kilograms, rather than saying that their weight is 55 kilograms.
Now just as the kilometre is equal to one thousand metres, so the kilogram is equal to one thousand grams, 1 kilogram = 1 000 grams. You will have seen the number of grams quoted on all kinds of packaged food. Very small quantities are measured in milligrams, where one milligram (mg) is one-thousandth of a gram, 1 milligram = gram. So, using abbreviations, 1 kg = 1 000 g, and 1 mg = g.
Question 5.1
Complete the blanks in the following relationships between units:
- a.5 km = … m = … cm = … mm
5 km = 5 000 m = 500 000 cm = 5 000 000 mm.
- b.… kg = 3 000 g = … mg
3 kg = 3 000 g = 3 000 000 mg.
- c.25 s = … ms
25 s = 25 000 ms.
Before we leave the discussion of units, there is one other important point to remember about the relationship between units. Suppose you had to add together 100 cm and 2 m, what would be the first step you would need to take? You would convert 100 cm to 1 m, so the calculation becomes 1 m + 2 m = 3 m. Alternatively, you would convert 2 m to 200 cm, so 100 cm + 200 cm = 300 cm. The same is true for all units, not just the units of length.
Question 5.2
Try the following calculations, which all involve conversions of units:
- a.7 kg + 4 000 g
4 000 g = 4 kg, since 1 000 g = 1 kg. So the calculation becomes
7 kg + 4 kg = 11 kg.
Alternatively, we could calculate the answer in grams. In this case,
7 kg = 7 000 g, and 7 000 g + 4 000 g = 11 000 g.
(The two answers are clearly equivalent: 11 kg = 11 000 g. Either one is correct.)
- b.55 cm – 40 mm
55 cm – 40 mm = 55 cm – 4 cm = 51 cm.
Alternatively, 550 mm – 40 mm = 510 mm.
- c.20 s – 1 000 ms
20 s – 1 000 ms = 20 s – 1 s = 19 s.
Alternatively, 20 000 ms – 1 000 ms = 19 000 ms.
5.1 Units in calculations
Suppose you walk a distance of 100 metres in a time of 50 seconds. Your average speed is given by dividing the distance by the time taken; in this case, 100 divided by 50 gives 2. But 2 what? Again, the answer needs to be quoted with units in order to be meaningful. Fortunately, the units of the answer can be found very easily; we divided the distance by the time taken and we can treat the units in a similar fashion. The units of the answer are metres divided by seconds, frequently written as m/s and said as ‘metres per second’. Rather than treating the numbers and units separately, it is better to include units as part of the calculation itself. So, in the example we have just been considering:
average speed = = 2 , more usually written as 2 m/s.
In the same way, if we multiply two lengths (measured in metres) together to give an area (see Section 6), it is obvious from the calculation that the units of the answer are m m, more usually written as m2 and said as ‘metres squared’ or ‘square metres’. For example:
4 m 3 m = 12 m m = 12 m2
Finally, suppose that we want to find out what fraction of a particular garden fertiliser is nitrogen, and that we know a 3 000 gram bag of the fertiliser contains 210 grams of nitrogen. To find the fraction of the total mass that is nitrogen, we need to divide 210 grams by 3 000 grams:
Notice that in the first step above we cancelled the unit of grams, since this was the same on the top and the bottom of the fraction. Units can be cancelled in the same way as numbers, and in this case the correct final answer is a fraction with no units. (i.e. 7%) of the mass of the fertiliser is nitrogen.
Question 5.3
Complete the following calculations, giving your answers with appropriate units:
- a.3 mm 2 mm
3 mm 2 mm = 6 mm2
- b.45 km 3 hours
45 km 3 hours = 15 km/hour
- c.12 000 kg 2 m3
12 000 kg 2 m3 = 6 000 kg/m3
- d.10 km 2 km

6 Measuring areas and volumes
6.1 Area
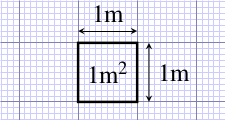
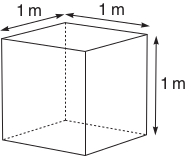
For squares and rectangles, the area is found by multiplying the length by the width. So a simple square with 1 m long sides (Figure 6.1) has an area of 1 m 1 m = 1 m2. In SI units, area is measured in square metres.
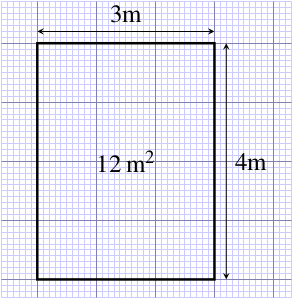
The rectangular garden pond shown in Figure 6.2 has an area of 3 m 4 m = 12 m2, and you can see that it is made up of 12 squares, each with sides 1 m long.
What is the area of a rectangular garden pond that measures 5 m 4 m?
The area is 20 m2.
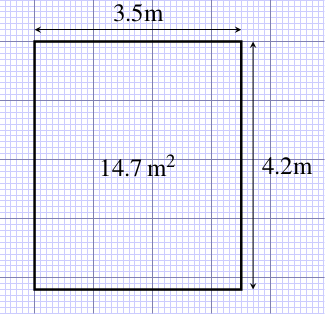
The rectangular garden pond shown in Figure 6.3 has an area of 3.5 m 4.2 m = 14.7 m2, which you can check with your calculator. The area is still the length multiplied by the width, and if you count up 12 whole squares and eight part squares you should be able to see that the pond covers the equivalent of about 15 whole squares, each of which has 1 m side length.
There are two ways of calculating the area of the L-shaped garden pond in Figure 6.4; can you see what these are?
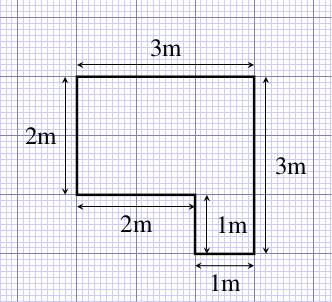 Figure 6.4 Plan of an L-shaped garden pond.
You could think of the pond as being a large rectangle, with a smaller rectangle taken out of it, as shown in Figure 6.5a. Or you could think of it as being made up of two rectangles, so that its total area is the sum of the areas of the two parts, as shown in Figure 6.5b.
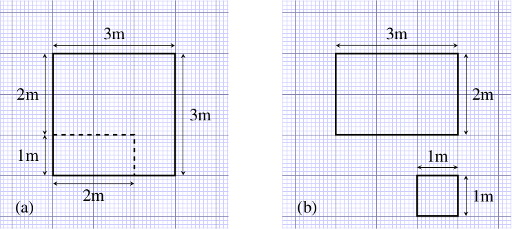 Figure 6.5 Two ways of calculating the area of an L-shaped garden pond.
We can check that these two ways of calculating the area give the same answer.
Following the first method, in Figure 6.5a, the area is 3 m 3 m minus 2 m 1 m. Adding brackets to a problem of this type makes it look clearer and also emphasises the mathematical rule of carrying out the multiplication before the subtraction:
area = (3 m 3 m) – (2 m 1 m) = 9 m2 – 2 m2 = 7 m2
If you work this out on your calculator, brackets are not essential because your calculator follows the mathematical rules and will do the multiplication before the subtraction.
Following the second method, in Figure 6.5b, the area is 2 m 3 m plus 1 m 1 m, and again if we add brackets it makes the problem look clearer:
area = (2 m 3 m) + (1 m 1 m) = 6 m2 + 1 m2 = 7 m2
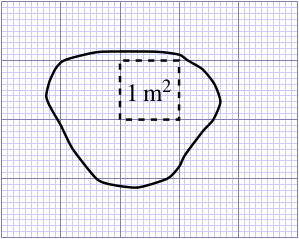
The concept of area is useful even for irregular-shaped objects; the irregular-shaped pond in Figure 6.6 has an area of about 5 square metres, and again you can verify this approximately, by counting up the metre squares and part squares.
6.2 Volume
Volume is a measure of the space that a three-dimensional object occupies. The volume of a rectangular block is found by multiplying its length by its width by its height. A simple cube with 1 m long sides (Figure 6.7) has a volume of 1 m 1 m 1 m = 1 m3 (said as ‘metre cubed’ or ‘cubic metre’). In SI units, volume is measured in cubic metres.
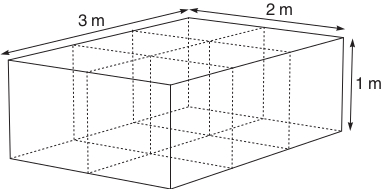
The fish tank shown in Figure 6.8 has a volume of:
3 m 2 m 1 m = 6 m3
and 6 cubes with 1 m sides could, in principle, be neatly stacked in the tank, as the dashed lines on the diagram indicate. For any rectangular block-like structure, such as a brick or a plank of wood, you can use the same method for measuring the volume: just multiply together the length, the width and the height, as we did for the tank in Figure 6.8.
Suppose you had measured the dimensions of a tank in centimetres, what would be the unit of its volume?
The unit would be cm cm cm, or cubic centimetres, which is abbreviated to cm3.
However, if you had measured one dimension in mm and the other two dimensions in cm, then before calculating the volume you would have to ensure all the dimensions were in the same unit.
What is the volume of a carton of fruit juice that has length 8 cm, width 45 mm, and height 12 cm?
Since 45 mm = 4.5 cm, volume of carton = 8 cm 4.5 cm 12 cm = 432 cm3.
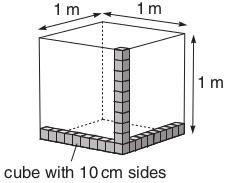
Unless you’re in the building trade, you are probably not used to measuring volumes in cubic metres. A unit that is much more commonly used for measuring volumes of liquids is the litre (abbreviated to l). Fruit juices and emulsion paint, for example, are sold in litre volumes. A litre is the volume of a cube that has 10 cm sides.
If you think about stacking cubes with 10 cm long sides in a 1 m cube (Figure 6.9), then you can see that we would need 10 10 10 = 1 000 of the 10 cm cubes to fill a cubic metre (1 m3), so
1 000 litres = 1 cubic metre (1 m3)
How many cubic centimetres (cm3) are there in 1 litre?
A cube with 10 cm sides has a volume of 1 litre. If you think about stacking 1 cm cubes in a 10 cm cube, then you can see that there are 10 10 10 = 1 000 of the 1 cm cubes in 1 litre, so 1 000 cm3 = 1 litre.
Question 6.1
A rectangular swimming pool has the following dimensions: 6 m long by 7 m wide and 2 m deep. What is the area of the bottom of the pool and what is the volume of the pool?
Area of the bottom of the pool is 6 m 7 m = 42 m2.
Volume of the swimming pool is 6 m 7 m 2 m = 84 m3.
Question 6.2
A reservoir is known to have the capacity to store 2.5 million litres of water. How many cubic metres is this?
Since 1 000 litres = 1 m3, then 2.5 million litres is
7 Scientific notation
7.1 Going up: powers of ten for large numbers
It is estimated that the total volume of water stored on the Earth is 1 460 000 000 km3.
When dealing with large numbers like one thousand four hundred and sixty million (1 460 000 000), it becomes tedious to write out the number in words or to keep writing out all of the zeros. Worse still, it is very easy to lose some of the zeros or add extra ones by mistake. Fortunately, we can refer to large numbers without having to write out all of the zeros. The powers of ten notation is less prone to errors and tedium because it removes the zeros. We will introduce the powers of ten notation with some numbers more manageable than 1 460 000 000, though.
One thousand is ten times ten times ten:
We can use powers notation (introduced in Section 1.2) to write
How do you think you would write 100 in powers of ten?
Two tens are multiplied together to give one hundred so the superscript after the 10 must be 2. That’s
When expressing 100 and 1 000 in powers of ten, there are no great savings on writing zeros, but what about one million (1 000 000)? One million is the product of multiplying together six tens:
so it is written as Now you begin to see the benefit of the powers of ten notation.
One thousand is often written not just as but as Spoken aloud, this would be expressed, ‘one times ten to the power three’ or just ‘one times ten to the three’. Likewise one million is either or simply Now we can give two alternative explanations that may help you to get to grips with powers of ten. First, the power of ten shows how many times 1 has been multiplied by 10. Taking as an example, 1 000 is seen to be Second, the power of ten shows how many places the decimal point has to move to the right to give the actual number. If we write 1 as 1.0 to remind ourselves where the decimal point is, then one move to the right would turn 1.0 into 10.0, a second move would give 100.0 and a third move would give 1 000.0, that is, one thousand.
You do not have to recall both of these ways of understanding powers of ten; just use the one that suits you best, or develop your own way of fixing the idea in your armoury of mathematical techniques.
Let’s go back to the total amount of water on the Earth. Using the powers of ten notation, 1 460 000 000 could be written as A significant saving on zeros! The complete number would be spoken as ‘one point four six times ten to the power 9’ or just ‘one point four six times ten to the nine’. The power of 9 tells us how many times 1.46 has been multiplied by 10 to give the final number of 1 460 000 000. It is nine times. That is, our number is comprised of:
To see clearly that this expression is still one thousand four hundred and sixty million, it helps to begin with 1.46 and work our way to the number we want by multiplying each time by ten:
If we carry on doing this, we end up with:
Alternatively, you can think of each increase by one in the power of ten as moving the decimal point one place to the right. That is, if you multiply 1.46 by 10 the decimal point moves one place to the right, giving 14.6.
Likewise, to multiply 1.46 by one thousand, the decimal point moves three places to the right, giving 1 460.0. In the powers of ten notation, this is written
There is a convention called scientific notation that is used when writing a number with a power of ten. Scientific notation requires the number accompanying the power of ten to be less than 10 but equal to or greater than 1. Let’s take the example of one million. It could be correctly expressed as , and so on, or even as , but only the first of these obeys the convention of scientific notation and this is the one that should be used. As a second example, it is quite correct mathematically to write 85 000 as , or , but correct scientific notation would demand
Scientific notation requires the number accompanying the power of ten to be less than 10 but equal to or greater than 1.
Question 7.1
Express the following numbers in scientific notation:
- a.100 000 000
when expressed in scientific notation
- b.400 000 000 000
when expressed in scientific notation
- c.35 000
when expressed in scientific notation
- d.
when expressed in scientific notation
- e.
when expressed in scientific notation
Question 7.2
Write out in full the numbers corresponding to:
- a.
when written out in full
- b.
when written out in full
- c.
when written out in full
- d.
when written out in full
Question 7.3
The average distance of the Earth from the Sun is 150 000 000 000 metres. Express this number in a more concise form that obeys the convention of scientific notation.
There are two ways of doing this. Starting with 1.5, the decimal point has to be moved 11 places to the right to produce 150 000 000 000. Therefore the power must be 11.
An alternative approach is to recognise that 1.5 has to be multiplied by 10 eleven times to obtain 150 000 000 000. Again, this tells us that the power term must be
7.2 Going down: powers of ten for small numbers
Let’s see how the powers of ten notation can be extended to cover small numbers, such as 0.000 000 000 25 m (the diameter of a water molecule).
Write down the next two numbers in each of the following two sequences.
| ……… | ……… | |||
| ……… | ……… |
In the first sequence, each successive number is divided by 10 (i.e. had one zero taken off the end) so the number that follows 100 is The next number in that sequence must result from another division by 10. That is, we must divide 10 by 10 and Therefore, the second answer is 1. In the second sequence of numbers, each successive number has 1 subtracted from its power, so the first answer is because 2 – 1 = 1. For the second answer, we must subtract 1 from the power 1. Because 1 – 1 = 0, the next answer is
In fact, both sequences are the same because 10 000 is , 1 000 is , 100 is , and 10 is . The implication is that and hence This makes perfectly good sense if you recall that, in the second sequence given above, the power is the number of times that 1 is multiplied by ten (e.g. ). For , 1 is multiplied by 10 no times at all, leaving it as 1.
Why stop at 1 or ? Using the same rules, write down the next number in each of these sequences.
| ……… | |||
| ……… |
In the first sequence, dividing 1 by 10 gives or 0.1 as the next number. In this box, we’re keeping to decimals, so the answer we want is 0.1. But what about the second sequence? The answer is more straightforward than it may seem. We continue to subtract 1 from the powers of ten so that the next number in the sequence has a negative power of ten, , because 0 – 1 = –1. Remembering that the two sequences are equivalent, it seems that This is exactly right! We could equally write
Just as a positive power of ten denotes how many times a number is multiplied by 10, so a negative power of ten denotes how many times a number is divided by 10. For , we must divide 1 by 10 just once and we end up with 0.1.
What is the meaning of ?
Because the power is now –2, we must divide 1 by 10 twice.
That is,
Another way to think about powers of ten for very small numbers involves shifting the decimal point. A negative power of ten denotes the number of places that the decimal point moves to the left. For example, think of , which we will write as to remind us of the position of the decimal point. Starting with the number 1.0, the power of –2 requires us to move the decimal point 2 places to the left. One place to the left gives 0.1 and two places 0.01.
We therefore have
Let’s try an example. Suppose a raindrop has a breadth of about 0.002 m. This distance could be given in scientific notation as m. This is clear from the following series.
- Start with:
- Divide by ten:
- Divide by ten again:
- And again:
Alternatively, in considering the meaning of ‘two times ten to the power minus three,’ you may wish to start with the number 2.0 and move the decimal point three places to the left to give 0.002.
You know from Section 7.1 that when expressing large numbers in scientific notation, the power of ten (which is positive) denotes the number of places that the decimal point moves to the right. Similarly, when expressing small numbers in scientific notation, a negative power of ten denotes the number of places that the decimal point moves to the left.
You have seen that a negative power of ten tells you how many times you need to divide by ten, so that
But, of course, , and so
This relationship between positive and negative powers of ten is quite general, so
Convention requires that, when writing large numbers in scientific notation, the power of ten should be accompanied by a number that is equal to or greater than 1 but less than 10. The same convention is used when dealing with small numbers and hence negative powers of ten. This is why 0.002 m, the breadth of the raindrop, is given in scientific notation as m, and not as m or m.
Question 7.4
Express the following measurements in scientific notation:
- a.a water molecule, about 0.000 000 000 25 m across
The starting point for quoting 0.000 000 000 25 in scientific notation is 2.5 (the number that lies between 1.0 and 9.9). The decimal point has to be moved ten places to the left to reach 0.000 000 000 25, so the power of ten must be –10 and the answer m.
- b.an average-sized sand grain on a gently sloping beach, about 0.000 25 m across
m
- c.the size of one particle of clay, the main constituent of mud, about 1/1 000 000 m across
First of all convert the fraction into a decimal. This is 0.000 001. In scientific notation this is m. Alternatively,
m = m = m
- d.the average size of a hailstone, 0.003 5 m across
m
Question 7.5
Write out in full the decimal numbers corresponding to:
- a.
To find the decimal number corresponding to , the decimal point in 7.3 has to be moved four places to the left to give 0.000 73. The alternative approach is to think of, and work out, .
- b.
0.000 000 29.
Question 7.6
Use powers of ten notation to answer the following questions:
- a.How many millimetres are there in one kilometre?
From the definition of the prefixes, 1 km = 1 000 m and 1 m = 1 000 mm. So
- b.How many kilometres is one millimetre equal to?
Since mm = 1 km, from the answer to Question 7.6(a), then
7.3 Using a calculator for scientific notation
In your future studies, you are likely to be doing many calculations with numbers in scientific notation, so it is important that you know how to input them into your calculator efficiently and how to interpret the results.
First of all, make sure that you can input numbers in scientific notation into your calculator. You could do this using the button you used to input powers in Section 1.2, but it is more straightforward to use the special button provided for entering scientific notation. This might be labelled as EXP, EE, E or EX, but there is considerable variation between calculators. Make sure that you can find the appropriate button on your calculator. Using a button of this sort is equivalent to typing the whole of ‘ to the power’. So, on a particular calculator, keying 2.5 EXP 12 enters the whole of
To enter a number such as into your calculator, you may need to use the button labelled something like (as used in Section 2.1) in order to enter the negative power.
To enter a number such as into your calculator using the scientific notation button, it is helpful to remember that is written as in scientific notation, so you will need to key in something like 1 EXP 9.
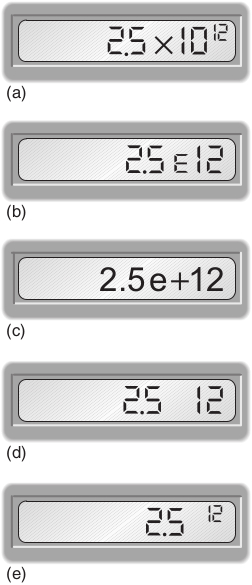
In addition to being able to enter numbers in scientific notation into your calculator, it is important that you can understand your calculator display when it gives an answer in scientific notation. Enter the number into your calculator and look at the display. Again there is considerable variation from calculator to calculator, but it is likely that the display will be similar to one of those shown in Figure 7.1. The 12 at the right of the display is the power of ten, but notice that the ten itself is frequently not displayed. If your calculator is one of those which displays as shown in Figure 7.1e, then you will need to take particular care; this does not mean on this occasion. You should be careful not to copy down a number displayed in this way on your calculator as an answer to a question; this could cause confusion at a later stage. No matter how scientific notation is entered and displayed on your calculator or computer, when writing it on paper you should always use the form exemplified by
Question 7.7
To check that you can use your calculator for scientific notation, do the following calculations:
- a.
- b.
- c.
If you obtained the incorrect answer , it is likely that you entered instead of into your calculator. Remember that can be written as
8 More about powers and units
8.1 Using positive and negative powers with units
Some important general results were introduced in Section 7.2, namely that
and that
Note that and are rarely used in scientific writing; it is usual to write simply 10, 1 or 0.1 instead. However, the use of positive and negative powers provides a useful notation that can also be used with symbols and units.
can be expressed as and (which could also be written as ) can also be expressed as
This way of converting between positive and negative powers is often used when expressing units concisely. Let’s take an example that you have already met, the unit of speed, which is metres per second, abbreviated in Section 5.1 to or m/s.
Can you think of a way to rewrite using a negative power?
Since can be written as
The conventional scientific way of expressing the unit of speed is , and a variety of units of measurement can be expressed in a similar way using positive and negative powers.
Notice that we have left a space between m and in the unit of speed, and we do this whenever we write a unit that is a combination of two or more other units. This is different from the way that prefixes for multiples of units are written; they are always written without a space between the prefix and the basic unit. Thus, ‘ms’ means ‘millisecond’, but ‘m s’ means ‘metre second’. This separation of the different components of a unit, but not for multiples of units, avoids confusion.
Question 8.1
Write each of the following using both positive and negative power notation.
For example,
- a.
- b.
Question 8.2
Express the following units using negative powers:
- a.kilometres per hour (written as km/hour in the answer to Question 5.3b)
kilometres per hour = km/hour = km hour–1
Note that hour could be abbreviated to either h or hr, and that there is a space between the units.
- b.milligrams per litre (note that the abbreviation for milligrams is mg and the abbreviation for litres is l)
milligrams per litre = mg/l = mg l–1
Note that there is a space between the units.
- c.kilograms per cubic metre (written as kg/m3 in the answer to Question 5.3c)
kilograms per cubic metre = kg/m3 = kg m–3
Note that there is a space between the units.
8.2 Prefixes used with SI units
Now that you have met powers of ten, we can introduce the complete range of prefixes used with SI units. These are given in Table 8.1.
So, for example, 1 Ms = s. This is about 11.5 days.
| Prefix | Symbol | Multiplying factor |
|---|---|---|
| exa | E | 1018 = 1000 000 000 000 000 000 |
| peta | P | 1015 = 1000 000 000 000 000 |
| tera | T | 1012 = 1000 000 000 000 |
| giga | G | 109 = 1000 000 000 |
| mega | M | 106 = 1000 000 |
| kilo | k | 103 = 1000 (Note that it is ‘k’ and not ‘K’.) |
| - | - | 100 = 1 |
| deci | d | 10-1 = 0.1 |
| centi | c | 10-2 = 0.01 |
| milli | m | 10-3 = 0.001 |
| micro | μ | 10-6 = 0.000 001 |
| nano | n | 10-9 = 0.000 000 001 |
| pico | p | 10-12 = 0.000 000 000 001 |
| femto | f | 10-15 = 0.000 000 000 000 001 |
| atto | a | 10-18 = 0.000 000 000 000 000 001 |
Footnotes
The order of the top six prefixes (in ascending order) can be remembered with the phrase ‘king Midas’s Golden Touch Poisoned Everything’.Question 8.3
Express each of the following in metres, giving your answers in scientific notation. Example: km = m.
- a.6.1 Tm
6.1 Tm = 6.1 1012 m
- b.3.5 nm
3.5 nm = 3.5 10-9 m
- c.1.7 μm
1.7 μm = 1.7 10-6 m
9 Significant figures
You were introduced, in Section 4.1, to the idea of expressing answers to a specified number of decimal places. The more precisely you know a number, the more digits it seems reasonable to include; remember that writing down all the digits given on a calculator display cannot usually be justified. Quoting answers to a specified number of decimal places can be helpful, but it can be difficult to specify precisely how many digits are required. For example, suppose you have been asked to specify a distance of 34 178.921 metres to two decimal places. In metres, the correct answer would be 34 178.92 m, but in kilometres the correct answer would be 34.18 km, and if you were to choose to use scientific notation, the correct answer would be m.
It is frequently more reliable to quote answers to a specified number of significant figures where, in straightforward cases, the number of significant figures is found simply from counting the number of digits. So a temperature of 16.472 3 °C could be quoted to five significant figures as 16.472 °C, to four significant figures as 16.47 °C, to three significant figures as 16.5 °C and to two significant figures as 16 °C. The number of significant figures displayed reflects the certainty with which the value is known; in general the last digit will be somewhat uncertain, but you can be confident of the other digits.
Question 9.1
To how many significant figures are each of the following measurements given:
- a.5.63 m
5.63 m is given to three significant figures.
- b.3 567.1 kg
3 567.1 kg is given to five significant figures.
- c.17 μs
17 μs is given to two significant figures.
Question 9.2
Express the number 5.683 12 to
- a.four significant figures
5.683
- b.two significant figures
5.7
Note that the digits following the ‘6’ round up, so the answer is 5.7 not 5.6.
Specifying the number of significant figures when zeros are involved can be a bit more tricky, as the following examples indicate:
- 0.082 m: here there are only two significant figures because initial zeros do not count. These initial zeros tell you only about the size of the number, and not about the precision to which it is known. The first significant digit in this value is the 8.
- 50.6 m: there are three significant figures here, since the zero in the middle of a number counts as a significant figure in the same way as the other digits.
- 79.0 m: there are three significant figures here too; a zero that is at the end of a number and after the decimal point has the same significance as any other digit; if this value was only known to two significant figures then it would have been quoted as 79 m.
- 900 m: this is the really tricky one! It could be that the value is known to three significant figures, that is, only the final zero is uncertain. But it might be that the distance has been measured only to the nearest 100 m (i.e. it lies between 850 m and 950 m). One way round this ambiguity is to state clearly the number of figures that are significant; for example to quote ‘900 m to one significant figure’. Alternatively, we can use scientific notation to resolve the ambiguity. Thus 9.00 102 m, 9.0 102 m and 9 102 m are all 900 m, but expressed to three significant figures, two significant figures and one significant figure respectively.
Question 9.3
To how many significant figures are each of the following measurements given:
- a.1.240 mm;
1.240 mm is given to four significant figures.
- b.0.019 mm
0.019 mm is given to two significant figures. Initial zeros don’t count.
- c.10.009 5 mm
10.009 5 mm is given to six significant figures.
- d.8.90 104 mm
8.90 104 mm is given to three significant figures.
9.1 Significant figures in calculations
The results of measurements are often used in calculations, and we then need to know how many figures to quote in the final answer. As a rule of thumb, when multiplying and dividing numbers, the number of significant figures in the result should be the same as in the measurement with the fewest significant figures. For example, if the length of a flower bed is 4.5 m and its width is 1.09 m, then the calculated area is 4.5 m 1.09 m = 4.905 m2. However, since the length of 4.5 m is measured only to two significant figures, we are only justified in quoting the area to two significant figures, so we would round the calculated value to 4.9 m2.
You may have a problem with multiple parts where you are asked to carry forward the answer from the first part and carry out further calculations. Always use the unrounded answer from the first part into the calculation for the second part and then round your answer.
For example, suppose we were asked to increase the area of the flower bed above by 0.048 m2. If we used the previously rounded figure of 4.9 m2 then the total area is 4.9 m2 + 0.048 m2 = 4.948 m2. This answer should still only be given to two significant figures, so it would be rounded down to 4.9 m2. However the correct method is to use the unrounded answer of 4.905 m2 from the first part. The total area is now 4.905 m2 + 0.048 m2 = 4.953 m2. Quoting this to two significant figures means that it should be rounded up to 5.0 m2.
Question 9.4
Do the following calculations and express your answers to the appropriate number of significant figures:
- a.0.43 m 1.2 s
Note: If you were using this result in subsequent calculations you should use the unrounded value, or a value quoted to at least one additional digit.
- b.2.373 m 3.6 m
Note: If you were using this result in subsequent calculations you should use the unrounded value, or a value quoted to at least one additional digit.
- c.6 342 kg 2.42 m3
Note: If you were using this result in subsequent calculations you should use the unrounded value, or a value quoted to at least one additional digit.
10 Reading data from tables
Tables provide a neat and concise way of displaying information. Table 10.1 illustrates various important features, common to all tables of this type:
- a title
- a heading at the top of each column
- the ‘volume’ heading includes the units (litres in this case), so the unit does not have to be repeated after each number.
Note the way in which the volume heading and its units have been quoted as ‘Volume/litres’.
It is conventional always to use ‘quantity divided by units’ (usually in the form ‘quantity/units’) in labelling the headings of tables and the axes of graphs.
| Use of water | Volume/litres |
|---|---|
| Domestic – mains water supply | |
| flushing lavatory | 44 |
| bath and shower | 23 |
| washing machine | 16 |
| dishwasher | 1 |
| outside use (garden, car washing) | 4 |
| miscellaneous (drinking, cooking, cleaning) | 48 |
| Non-domestic – mains water supply | |
| commercial and industrial use | 189 |
| Non-domestic – rivers and underground supplies | |
| agriculture | 7 |
| electricity generation | 220 |
| industry | 52 |
When reading a value from the table, for example the estimated amount of water used in washing machines, the units from the heading must be re-attached to the appropriate number. In the case of the example, the units of litres must be given alongside the number 16; 16 litres of water are used in washing machines per person per day in the UK.
The way in which the table heading is given as ‘volume/litres’ is a reminder of the fact that the value (16 litres) has been divided by litres. The litres then cancel to give a pure number in the table:
Question 10.1
To practise reading the information presented in Table 10.1, answer the following questions:
- a.How much water does the average person in the UK use each day in the home for flushing the lavatory?
The number given in the second column of Table 10.1 on the same line as ‘flushing lavatory’ is 44, and we attach the units ‘litres’ to this. So the average person uses 44 litres of water per day for this purpose.
- b.What does the number 7 in the third row from the bottom of the table mean?
The entry in the third row from the bottom of the first column of the table is ‘agriculture’, so the number 7, together with the table title and the column heading, tells us that the use of water for agriculture in the UK is equivalent to 7 litres per day for each person in the country.
Now look at Table 10.2. The ‘Mass’ heading includes not just a unit but a power of ten too. This has been done to avoid giving a power of ten alongside each value and thus to make the table less cluttered; it also makes it easier to compare the different masses. Not only has the mass of each planet been divided by kg, it has also been divided by 1020, and both the units and the power of ten need to be re-attached when data are extracted from the table. Thus the mass of Mercury is 3 302 1020 kg, which is 3.302 1023 kg in scientific notation (since the decimal point has to be moved a further three places).
| Major planet | Mass/1020 kg |
|---|---|
| Mercury | 3 302 |
| Venus | 48 690 |
| Earth | 59 740 |
| Mars | 6 419 |
| Jupiter | 18 990 000 |
| Saturn | 5 685 000 |
| Uranus | 866 200 |
| Neptune | 1 028 000 |
Question 10.2
Use Table 10.2 to find the mass of the planet Uranus.
Remembering to incorporate the ‘1020 kg’ from the column heading, the mass of Uranus is 866 200 1020 kg. In scientific notation, this is 8.662 1025 kg to four significant figures (since the decimal point needs to be moved an additional five places).
11 Representing data: pie charts, bar charts and histograms
The well-known saying that a picture is worth a thousand words reflects the fact that we can derive a lot of information from pictorial representations of a situation. Sections 11 and 12 look at various methods used by scientists to represent data in a pictorial way.
11.1 Pie charts
Figure 11.1a shows a circular pie. If we divide the pie into four equal portions, as shown in Figure 11.1b, then each portion is or 25% of the whole pie.
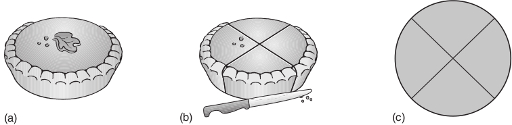
If we divide the pie into five equal portions, what percentage of the whole pie would each portion represent?
Each portion would represent , that is 20% of the whole pie.
Pie charts give a quick visual impression of the proportions that something is divided into; remember that the whole pie represents 100%.
We can present the data in Table 11.1 by a pie chart, as shown in Figure 11.2. Here, the sizes of the portions reflect the percentage composition of the Earth’s atmosphere at sea-level. Thus the whole pie (100%) represents the atmosphere, the largest segment (77.6%) represents the proportion of nitrogen, the next largest segment (20.9%) represents the proportion of oxygen, and so on.
| Component | Proportion/% of total |
|---|---|
| nitrogen | 77.6 |
| oxygen | 20.9 |
| argon | 0.93 |
| water (average value) | 0.5 |
| carbon dioxide | 3.6 10-2 |
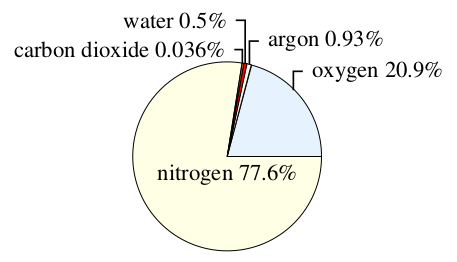
Note that pie charts can be drawn in a three-dimensional style, as shown in Figure 11.3. The two-dimensional representation in Figure 11.2 shows the proportions more accurately, though the three-dimensional representation is frequently used. In an accurate pie chart, the angle at the centre of the pie chart should correspond to the proportion of the component in question. Angles are measured in degrees (represented by the symbol °) and there are 360° in a circle (see Figure 11.4). So, in Figure 11.1c, where each of the segments represents of the whole, the angle at the centre of each segment is .
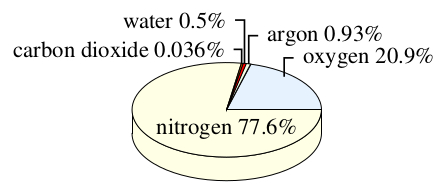
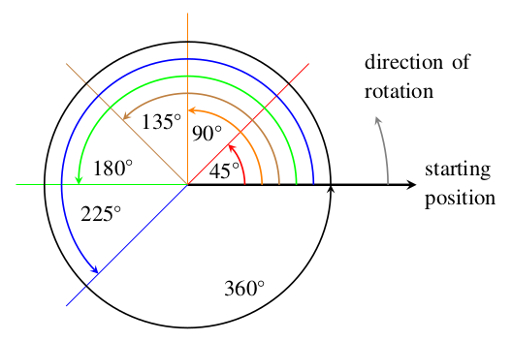
Question 11.1
What angle would you need to use for a segment of a pie chart representing 10% of the whole?
10% () of 360° is 36° so the required angle is 36°.
11.2 Bar and column charts
Bar and column charts are used to summarise data in discrete categories, such as human eye colour, blood group, species of plant etc. The categories are listed along a reference line, usually a horizontal one (the so-called horizontal axis). The number or percentage of things or events falling into each category is represented by a bar, and the scale for these bars, most commonly expressed as a number or a percentage, is usually given on the vertical axis. The bars don’t have to be shown vertically; they can run horizontally. A chart with vertical bars may be called a ‘column chart’ but there is no other difference. Figure 11.5 shows a bar chart depicting the number of insect species supported by each of seven different types of tree in the UK. Notice that the bars on the bar chart do not touch; this is because each bar refers to a separate distinct category.
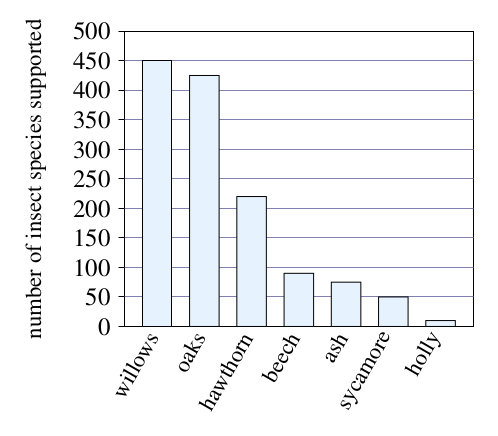
Roughly how many species of insect are associated with hawthorn?
Reading the value on the vertical axis, the top of the ‘hawthorn’ bar is just less than halfway between 200 and 250, so we can estimate that about 220 species of insect are associated with hawthorn.
11.2.1 Stacked bars and columns
The stacked bar or column chart shows how the total specified by the overall length or height can be broken down into two or more components. These are indicated in different colours or patterns, specified in the legend below the chart.
For example Figure 11.6 shows energy use in Denmark broken down into different fuels. The scale is marked in Petajoules (PJ).
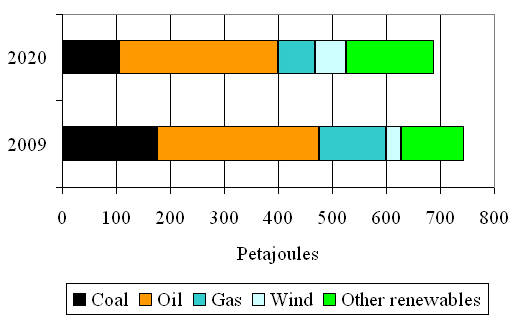
Roughly how many petajoules of energy from oil is Denmark projected to use in 2020?
The top bar shows data for 2020. Oil energy use is shown by the orange section. This runs from about 105 PJ at the left to 400 PJ at the right. So the energy use from oil is 400 PJ – 105 PJ = 295 PJ.
11.3 Histograms
A histogram is similar to a bar chart in that numbers or percentages are again commonly plotted vertically, but on a histogram the horizontal axis is used to represent a continuously variable quantity such as height, mass or time. The purpose of a histogram is to show how the data are distributed into groups across a continuous range. Figure 11.7 shows a histogram which presents the results of measurements taken of the height of 100 irises. In principle, a plant selected at random could be of any height. Of those measured, a few specimens are particularly tall and a few are particularly short, but the majority are of intermediate height; this is typical of natural variation in populations. Note that on a histogram (as compared with a bar chart) the columns touch, because the entire range of values is represented. For the same reason, the height interval of 110 cm to 115 cm is included, even though there are no irises of this height. Finally, note that the height intervals are of equal size. This is common practice, although there are ways of constructing histograms using unequal intervals.
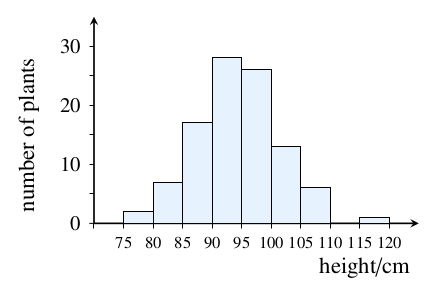
Question 11.2
Approximately how many of the irises in the field trials were less than 85 cm tall?
We need to combine data from two of the height intervals to obtain the answer. Reading from the vertical scale (note that there are divisions marked for every 5 plants) there are about 2 irises between 75 cm and 80 cm in height, and there are about 7 irises between 80 cm and 85 cm in height, so altogether there are approximately 9 irises of less than 85 cm.
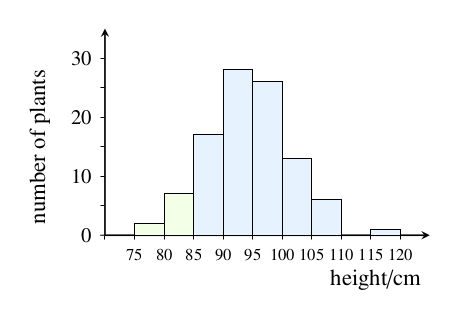
12 Representing data: graphs
12.1 Reading information from a graph
Graphs are used to illustrate the relationship between two quantities; for example Figure 12.1 shows the way in which the height of a girl changes as her age increases.
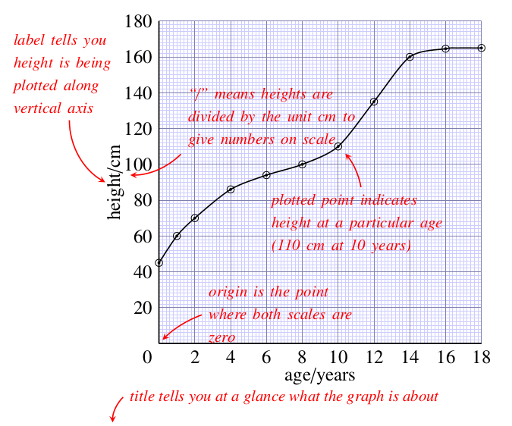
Figure 12.1 illustrates some very important points to be borne in mind when reading data from any graph of this sort.
Notice that the vertical axis has been labelled ‘height/cm’. The label includes the unit, in the same way as in the headings of tables. On some graphs the label includes a power of ten too – take care to look out for this.
Returning to Figure 12.1, the combination of the label and the scale on the vertical axis tells us that the numbers correspond to height in centimetres, that is, 0 cm, 20 cm, 40 cm, etc. So as we move vertically upwards on the graph, the girl’s height increases by 20 cm for each 1 cm on the graph paper. Look at Figure 12.2, which shows an enlarged version of the small section of the vertical scale between 20 and 40 cm on Figure 12.1. Because the horizontal lines on the graph in Figure 12.2 are equally spaced, we can work out what values of height correspond to each of the lines. The 20 cm difference between 20 cm and 40 cm has been divided into 10 small equal divisions, so each small division represents = 2 cm. So the horizontal lines on the enlarged graph have been marked 22, 24, 26, and so on. The point on the axis indicated by arrow ‘A’ corresponds to 28 cm, and the point indicated by arrow ‘B’ corresponds to 36 cm. A point that is halfway between the lines marked 34 and 36 corresponds to 35 cm.
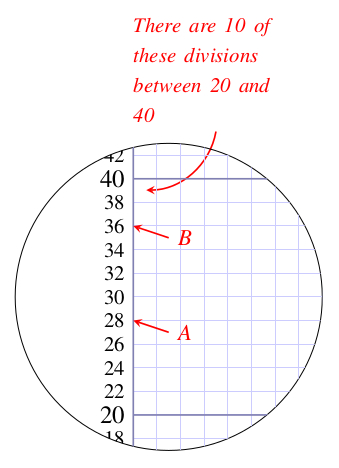
The horizontal axis in Figure 12.1 has a scale numbered 0, 2, 4, 6, …18; these numbers correspond to the age in years. The successive numbers are separated by 1 cm, so this is also a uniform scale. For every 1 cm that we move from left to right on the graph, the age of the girl increases by 2 years.
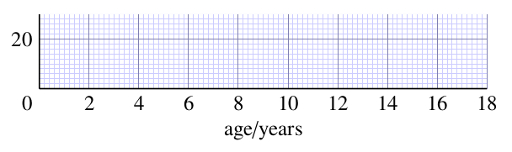
How much does the age of the girl increase for each small division?
Since 10 small divisions represent 2 years, one small division (1 mm) represents = 0.2 years. This is about 10 weeks.
The combination of title, axes, axis labels, scales and graph paper give a framework for displaying the results of measurements, and these are represented by the circled points on the graph in Figure 12.1. The position of a point on the graph represents a pair of related measurements; the horizontal position of a point represents the girl’s age, and the vertical position corresponds to her height at that age.
To work out the height for a particular point, you can draw a horizontal line from the point to the vertical axis, and read off the appropriate number from the scale.
What is the height for the third point from the left on the graph in Figure 12.1?
70 cm; you can find this value by drawing a line horizontally from the third point to the vertical axis.
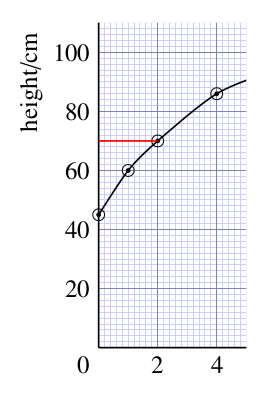
The corresponding age is read by drawing a line vertically downwards from the point to the horizontal axis.
What is the age for the third point from the left in Figure 12.1?
2 years; you can find this value by drawing a line vertically downwards from the third point to the horizontal axis.
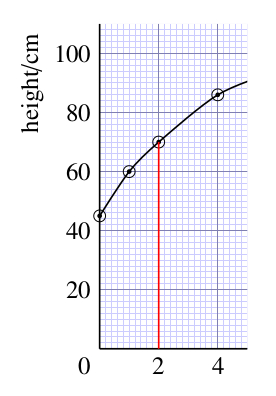
An alternative to drawing lines on the graph is to lay a ruler on the graph, horizontally or vertically, to help your eye follow a line from a point on the graph to the axis.
The 11 circled points on the graph represent measurements of the girl’s height at different ages. The points have been joined together with a smooth curve to represent the overall trend of the measurements, and this gives an immediate visual picture of how the height has changed.
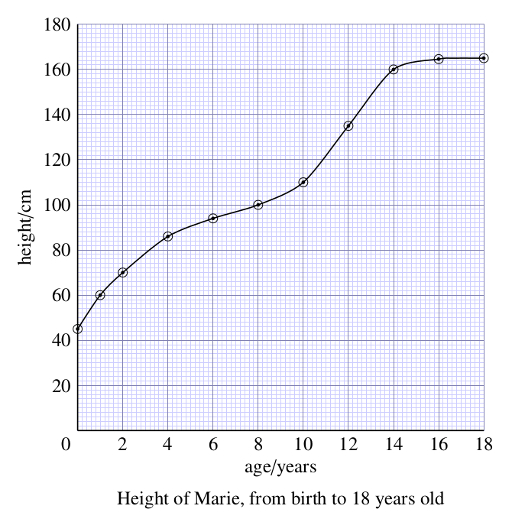
What is the trend of the girl’s height with increasing age?
The girl’s height increased rapidly in the first couple of years, and her growth then slowed down – the curve becomes flatter. There was another growth spurt corresponding to the onset of puberty, between 10 and 14 years, and her height then remained almost constant at about 165 cm. (This last height is 2 divisions above160 cm, and since each division is 2 cm, the height must be 2 2 cm = 5 cm above 160 cm.)
The smooth curve allows us to estimate the height of the girl at ages between those at which the actual measurements were made. So to estimate her height at 7 years, we find 7 years on the age axis, follow a vertical line upwards from here to the curve, and then follow a line from this point on the curve to the vertical axis, and read the appropriate value for the height from the scale on the axis; it’s about 97 cm. This process of determining intermediate values between the plotted points is known as interpolation.
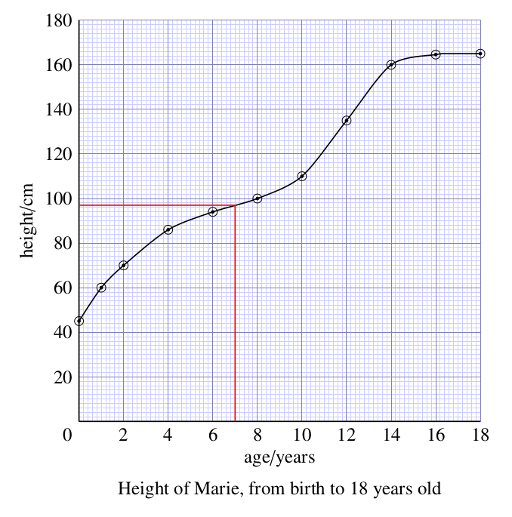
Question 12.1
Use the graph to estimate the girl’s height at 11 years.
Following a vertical line upwards from 11 years on the horizontal axis to the curve and then following a horizontal line left from this point on the curve to the vertical axis gives a value of approximately 122 cm.
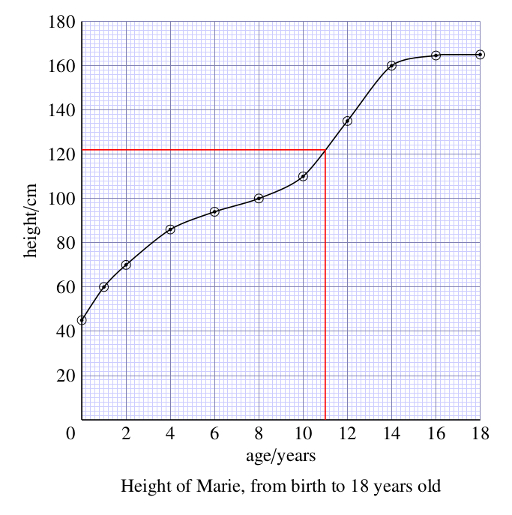
Question 12.2
To practise reading graphs, study Figure 12.3 and answer the following questions.
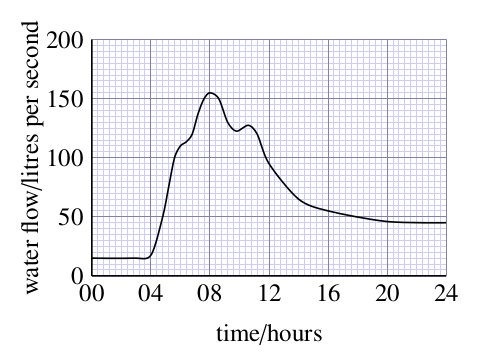
- a.What is the subject of this graph?
The subject of this graph is the volume of water flowing each second past a point in a stream after heavy rain. (The title or caption is usually the best place to find out what a graph is showing.)
- b.What quantity is plotted on the vertical axis, and in what unit is it measured?
Water flow, measured in litres per second, is plotted on the vertical axis.
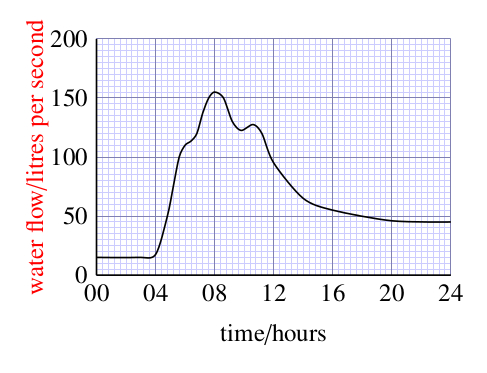
- c.What is plotted on the horizontal axis, and in what unit is it measured?
Time is plotted on the horizontal axis, and this is measured in hours. (The 24-hour clock has been used, so the period covered is 1 day.)
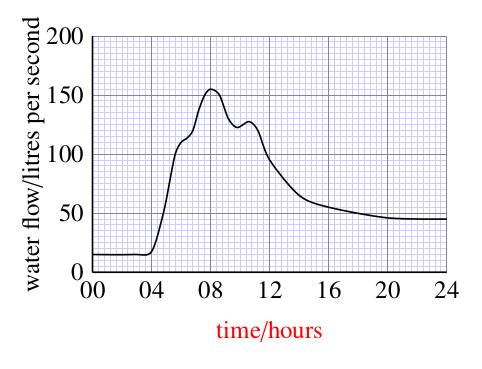
- d.What was the water flow of the stream at 12.00 hours?
At 12.00 hours, the water flow was about 95 litres per second. (Found by following a line vertically upwards from 12.00 hours to the curve, then following a horizontal line left from this point on the curve to the vertical axis and reading from the scale. In this case, the line intersects the scale one division below 100. Since 10 divisions correspond to 50 litres per second, 1 division corresponds to 5 litres per second, and so the flow is (100 – 5) litres per second, or 95 litres per second.)
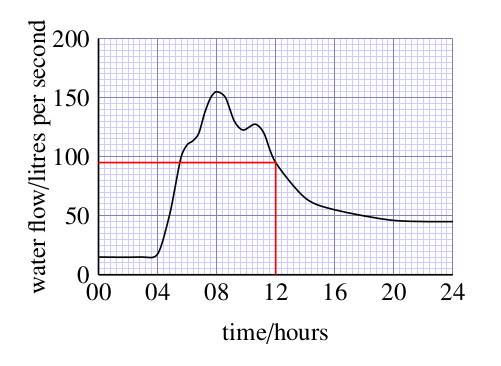
- e.What was the maximum flow of the stream and at what time did it occur?
The maximum flow was about 155 litres per second, and this occurred at approximately 08.00 hours. (The maximum flow corresponds to the peak of the curve; by drawing horizontal and vertical lines from the peak to the axes you can read off the flow and the time respectively.)
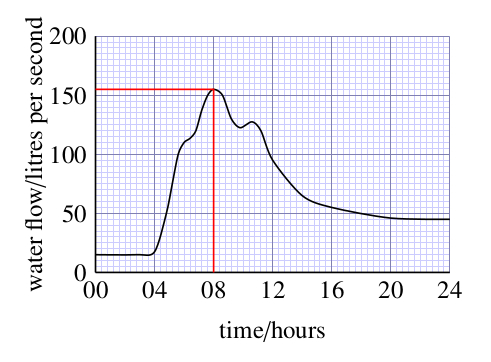
- f.Describe in words the way that the water flow changed over the period plotted on the graph.
The flow was steady until 04.00 hours, and then it increased very rapidly for about two hours. After this it increased more slowly until it reached a maximum flow at 08.00 hours. It then started to decrease; there was a small peak at about 11.00 hours, and the flow gradually decreased until it became fairly steady after 20.00 hours, at a greater flow than at the start of the day.
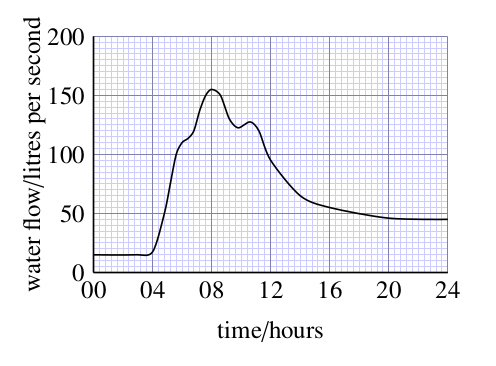
12.2 The gradient of a graph
We often want to know how one quantity varies with respect to another. We may be interested in the actual value of one quantity for a particular value of the other quantity (as in Section 12.1), but it is more often the rate at which one quantity varies with respect to another that is of more importance. The slope or gradient of a graph gives us a method of finding rate of change. We have already discussed the fact that Figure 12.1 shows us that the girl’s height increased rapidly in the first couple of years and then her growth slowed down. We know this because the gradient (slope) of the graph is initially steep but then becomes shallower.
In this activity, there is only space to discuss how to find the gradient of a simple straight-line graph, such as the ones shown in Figure 12.4. A straight-line graph is one in which quantity plotted on the vertical axis varies at a steady rate with respect to the quantity plotted on the horizontal axis. In other words, the gradient of the line is constant.
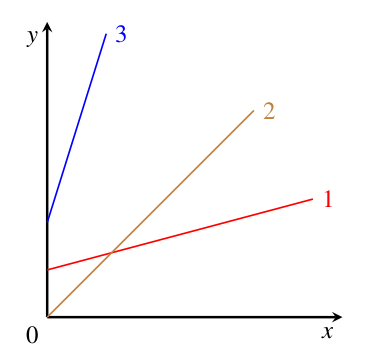
Which of the lines in Figure 12.4 has the largest gradient and which has the smallest gradient?
Line 3 has the largest gradient – this is the steepest slope. Line 1 has the smallest gradient – it has the smallest change in the vertical direction for any particular change in the horizontal direction.
The gradient of a straight line is defined as:
This is sometimes stated as:
To work out the gradient of a straight line on a graph, we simply need to take any two points on the line (to increase the precision of the calculation, the points should be quite well separated) and find the change in vertical value (the rise) corresponding to a particular change in horizontal value (the run). As an example, let’s find the gradient of the graph shown in Figure 12.5.
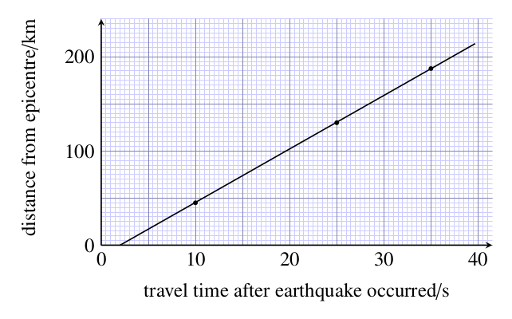
Figure 12.6 shows that as the horizontal value increases from 4 s to 32 s, the vertical value increases from 10 km to 170 km. Thus the run is (32 – 4) s = 28 s and the rise is (170 – 10) km = 160 km and the gradient is given by:
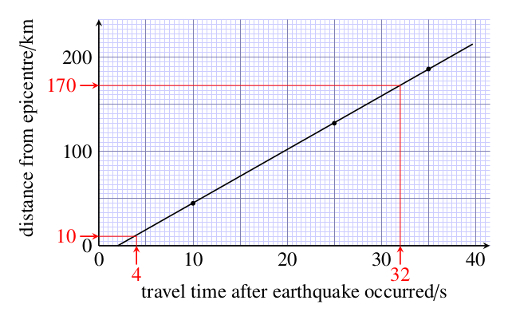
The gradient of a graph can have units, just like any other calculated quantity. In the example here, we have divided kilometres by seconds so the unit of the gradient is km s-1, which is a unit of speed. The gradient gives a measure of the speed at which the earthquake waves travel through the Earth from the epicentre to the detectors.
Note also that the rules for significant figures in calculations, introduced in Section 9.1, apply here too. In the example above, the run is given to two significant figures, so the answer is correctly given to two significant figures too.
Question 12.3
A large ornamental pool with straight sides and a flat bottom is filled with water. A meter registers the volume of water pumped into the pool. As the pool fills, the depth of water is measured. Figure 12.7 shows a graph in which the depth of water is plotted against the volume of water added. Calculate the gradient of this graph.
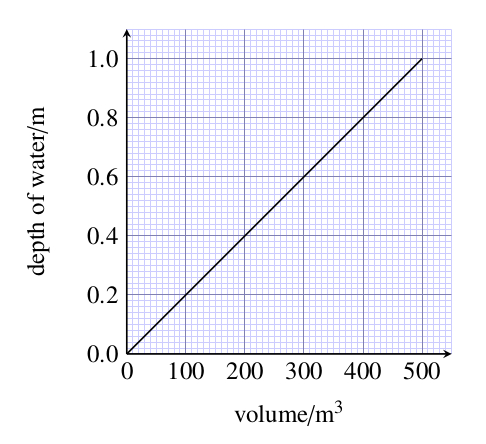 Figure 12.7 Graph for use with Question 12.3.
You may use any reasonably well separated pair of points on the graph to calculate the gradient, and should obtain approximately the same answer whichever points you choose. Taking the points corresponding to a volume of 0 m3 and a volume of 500 m3 gives:
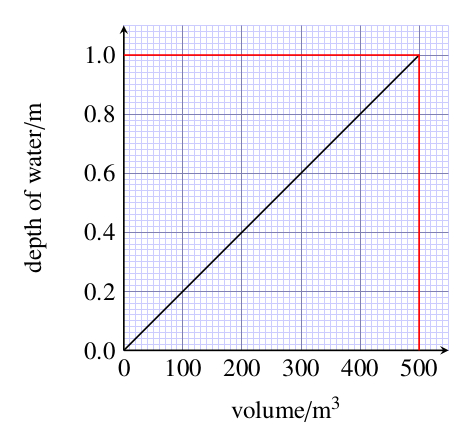
12.3 Plotting a graph
This discussion of how to plot a graph is based on the data shown in Table 12.1, which comes from an experiment in which the volume of a mixture of yeast, sugar and water at 25 °C was observed to increase with time. When plotting a graph of these results, or any similar data, you should work through the following stages.
| Elapsed time/min | Volume/ml |
|---|---|
| 0 | 150 |
| 3 | 150 |
| 6 | 155 |
| 9 | 170 |
| 12 | 200 |
| 15 | 215 |
| 18 | 245 |
| 21 | 275 |
| 24 | 305 |
Stage 1 Choose your axes
The first thing to decide is which of the two sets of readings (elapsed time and volume in this case) should go on which axis. In this experiment, the time intervals at which readings were to be taken had been decided in advance, before the investigation began, i.e. they were fixed. Such fixed information – termed the independent variable – is conventionally plotted on the horizontal axis, frequently referred to as the ‘x-axis’. The volume readings depend on the time at which the reading was taken and, consequently, these are termed the dependent variable. Such quantities, which depend on other variables, are plotted on the vertical axis, frequently referred to as the ‘y-axis’.
Stage 2 Choose your scale
Having decided that elapsed time should go on the horizontal axis and volume should go on the vertical axis, next you need to decide what scale to use on each axis. You should aim to use as much of the graph paper as possible (so that the graph is as large as possible, which makes it easier to read the values) while avoiding scales that are awkward to read and thus potentially confusing.
Look at the data in Table 12.1. What ranges of values need to be represented horizontally and vertically?
The horizontal axis needs to include times from 0 to 24 minutes. The vertical axis needs to include volumes from 0 to 305 ml (it would also be acceptable to plot a graph just showing volumes from 150 to 305 ml).
Assume your graph paper covers 13 cm in the direction you have chosen for the horizontal axis. You could use each 1 cm to represent 2 minutes, as shown in Figure 12.8.
Assume your graph paper covers 17 cm in the direction you have chosen for the vertical axis. What scale would be appropriate to include volumes of 0 to 305 ml?
One possibility is to use each 1 cm on the vertical axis to represent 20 ml, as shown in Figure 12.9, so each small 1 mm square represents 2 ml.
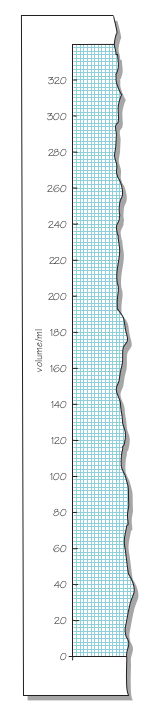 Figure 12.9 Choosing the scale for the vertical (volume) axis.
In this example, both scales start from zero (the origin of the graph) but this is not essential – the scale for the vertical axis could equally well start at, say, 140 ml, which would make better use of the graph paper.
You should aim to use as much of the graph paper as possible when plotting a graph. However, sometimes it is not possible to do this without using a different scale that is difficult to use. For example, the value for a volume of 215 ml at 15 minutes might fall between the labelled divisions in an awkward way, so it is best to aim for straightforward scales where the plot uses at least half the graph paper. In Figures 12.8 and 12.9, 1 cm represents 2 minutes on the horizontal scale and 1 cm represents 20 ml on the vertical scale, respectively. In general terms, multiples of 2, 5 and 10 are usually satisfactory; scales involving multiples of 3 are to be avoided!
One final point relates to the orientation of the graph paper. Sometimes simply rotating the graph paper from portrait to landscape can make it much easier to find suitable scales, as shown in Figure 12.10.
Stage 3 Label your graph
For a graph to convey meaning to other people, it must be completely labelled. Each axis should be labelled with the quantity it represents (elapsed time or volume in this case), followed by a forward slash (/), followed by the units (min or ml). So the vertical axis of the graph should be labelled ‘volume/ml’ and the horizontal axis should be labelled ‘elapsed time/min’.
In addition to having labelled axes, the graph itself should have a title. This should include information about the content of the graph: for example, it needs to be clear that the graph illustrates the variation of the volume of the yeast mixture with elapsed time. The title should also include some information about the temperature.
What would be a suitable title for the graph being plotted on this occasion?
Here is one suggestion: ‘Graph showing the variation of the volume of yeast mixture with elapsed time, at 25 °C’.
Stage 4 Plot the points
You are now ready to plot the points. Follow a procedure similar to the one you used to read the value from a graph in Section 12.1. So, to plot the point for which the elapsed time is 6 minutes, you should draw a real or imaginary line up from the horizontal axis for an elapsed time of 6 minutes (Figure 12.11). Similarly, since the volume of mixture was measured as 155 ml at this time, you should draw a real or imaginary line across from the vertical axis for a volume of 155 ml. Your point should be at exactly the place where the two lines meet.
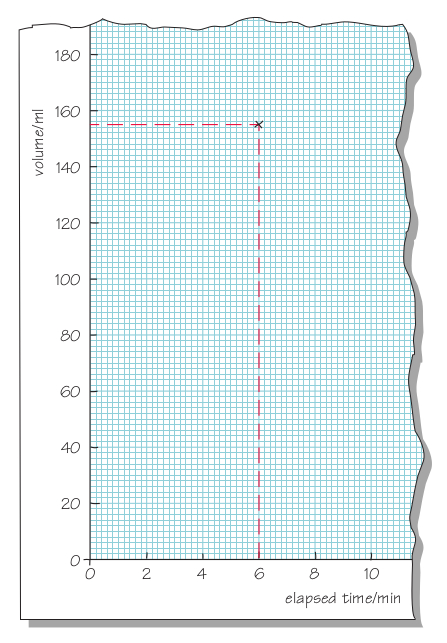
Several different conventions are used to indicate points on a graph, , + and being the best (Figure 12.12), but it does not matter which one you use. These marks make it clear exactly where the centre of the point is: for and + it is where the two lines cross, and for it is at the dot in the centre of the circle. The circle drawn around the dot simply makes the point clearer – it can be very difficult to see just a dot when you come to draw the curve. It also makes it difficult for other people to see where you have positioned the point.
It is very easy to make a mistake when plotting points and drawing a curve through the points, so you are advised to use a pencil rather than a pen for these tasks – and to have an eraser ready. There are computer programs which will plot points for you and draw the curve but, unless there is a reason why you cannot plot graphs by hand, you should make sure that you know how to do this.
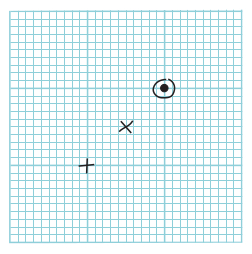
Stage 5 Draw a curve through the points
When you have plotted all of the points on the graph, all that remains to be done is to draw a curve that best represents the data. Before doing this, hold the graph paper at arm’s length and look at the points. Most of the graphs that you draw will represent a general trend, for example the way in which a child’s height increases with age, or a yeast mixture increases in volume as time passes. These are both continuous processes: you would not expect the child’s height to increase one month and then decrease the following month. However, with real experimental data, uncertainties in measurements sometimes lead to readings which vary in a rather erratic way (Figure 12.13). Provided you are sure that your graph represents a general trend (which is usually the case), you need to draw the smooth curve which best represents the data, not a series of short lines joining the individual points.
If the points appear to represent a uniform variation, the ‘curve’ which best represents them will be a straight line, as in Figure 12.13c. This is known as the best-fit line.
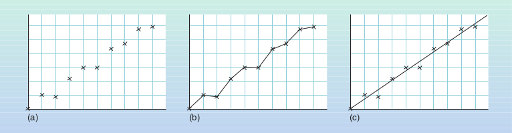
If common sense tells you that the line should go through the origin, the line can be drawn in this way. (For example, if it represents the variation of mass with volume for a series of aluminium blocks, when there is no volume it is reasonable to assume that there is no mass either.) Apart from this, the line should be drawn so that there is approximately the same number of points above the line as below it, at approximately similar distances from the line. Note that, generally, it is not necessary for any of the points to lie right on the best-fit line.
If it seems that the data cannot be represented by a straight line, a smooth best-fit curve should be drawn. This is a more difficult skill, but the same general principles can be applied, leading to a curve which is the best representation of the data as a whole.
Many people find it easiest to draw a smooth curve if they place the graph so that their hand is inside the curve (Figure 12.14).
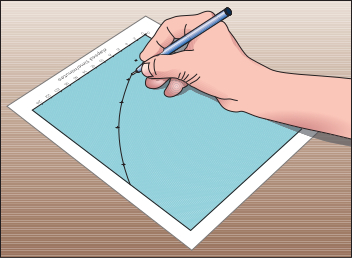
The completed graph for the data in Table 12.1 is shown in Figure 12.15, with a smooth curve drawn to represent the points. Note the point with an elapsed time of 12 minutes and a volume of 200 ml. This point does not seem to follow the general trend; it is probably the result of a measurement error during the experiment. It is best to ignore such points when drawing best-fit curves.
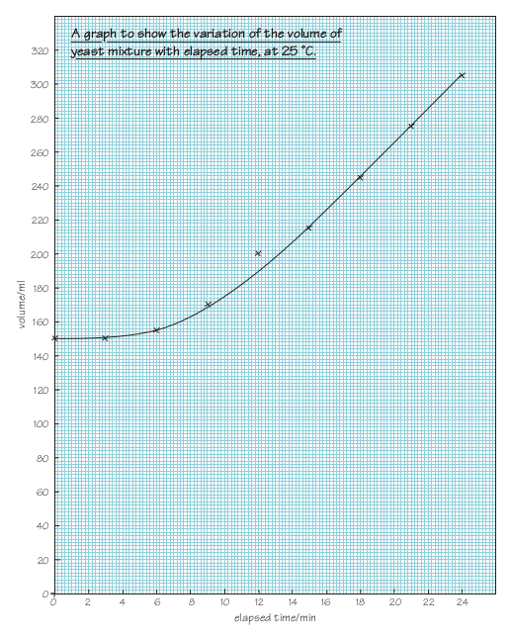
12.4 More complicated graphs
12.4.1 Multiple lines and area charts
Graphs may show multiple lines, allowing a comparison between different categories. The different lines may be identified by using different colours or shaped markers set along the lines. The colours or marker shapes are shown in a legend next to the chart. For example Figure 12.16 shows world fossil fuel energy consumption for three different fuels.
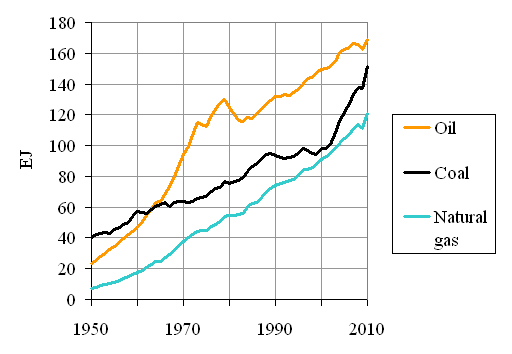
World consumption of oil has been highly dependent on its price. The world price of oil shot up by a factor of ten in only eight years as a result of a war in the Middle East and a later revolution in Iran. Can you spot the effects of these and say roughly when they occurred?
Oil consumption was increasing steeply until 1972, but by 1980 was falling. Something serious obviously happened between these two dates.
We may wish to show the same data to illustrate how each fuel contributes to the total world fossil fuel consumption. Figure 12.17 shows the data as an area chart. In this case the world coal consumption is shown in black at the bottom. The oil consumption is added above, but its consumption for any particular year is only the height of the yellow part of the chart. The natural gas consumption is again added on top. An area chart is a good way of showing a total and its components but it is less easy to appreciate changes in one particular component.
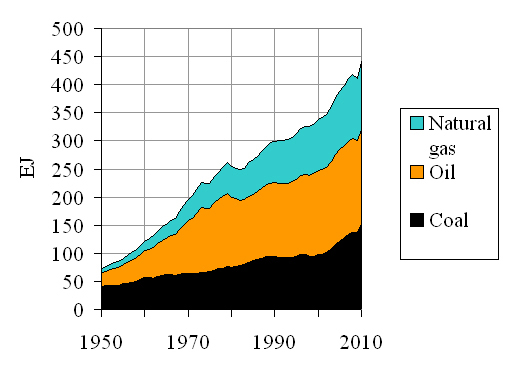
13 Equations and symbols
The word ‘equation’ is used for an expression containing an equals sign. The quantities under consideration may be described in words, for example
in which case the equation is known as a ‘word equation’, or the quantities may be represented by symbols, for example
but the important thing to remember is that what is written on the left-hand side of the ‘=’ sign must always be equal to what is written on the right-hand side. Thus, as explained in Section 14.5, you should never use ‘=’ as a shorthand for anything other than ‘equals’.
You know (from Section 6.1) that, for squares and rectangles, the area is found by multiplying the length by the width and that, for rectangular block-like structures, the volume is found by multiplying its length by its width by its height.
Write word equations (i.e. expressions involving an equals sign like that given above for average speed) for the area of a rectangle and the volume of a rectangular block.
Area = length times width,
i.e. area = length width (or equivalently, area = width length).
Volume = length times width times height,
i.e. volume = length width height
Writing out all of these words is rather tiresome. However, equations can be expressed far more compactly if each word is replaced with a single letter, so the equation for the volume of a rectangular block might become:
where V represents volume, l represents length, w represents width and h represents height.
Rewrite the word equation , using letters instead of words.
The choice of letters was left up to you, so there is no single right answer. If you chose the symbol d to represent density, m to represent mass and v to represent volume, your equation will be d = . (Note that the symbol representing a quantity is usually written in italics. This is particularly important where the symbol is also used as an abbreviation for a unit. For example, m is used here to represent mass but m is the abbreviation for metre.)
It is reasonable to use the first letter of each quantity (e.g. m for mass). It makes the choice of letter more memorable and this is a perfectly acceptable answer. However, d for density might be confused with d for distance and v for volume might be confused with v for velocity. So, scientists try to reserve one letter for each commonly used quantity. Unfortunately, there aren’t enough letters in the alphabet, so it is conventional to use the Greek letter ρ (pronounced ‘rho’) to represent density and a capital V to represent volume, so the equation for density becomes:
Similarly, speed is conventionally represented by v (for ‘velocity’), so using d for distance travelled and t for time taken, the equation for speed becomes:
There is one more convention that you need to know about:
When using symbols instead of words or numbers, it is conventional to omit the multiplication sign, ‘’.
So, the equation for the volume of a rectangular block becomes:
where V represents volume, l represents length, w represents width and h represents height.
Equations 13.1, 13.2 and 13.3 will enable you to calculate density, average speed and the volume of a rectangular block.
Question 13.1
- a.An ice cube can be considered to be a rectangular block of ice with a length of 3 cm, a width of 2 cm and a height of 15 mm. What is the volume of such an ice cube?
where V is volume, l is length, w is width and h is height. In this case:
l = 3 cm
w = 2 cm
h = 15 mm = 1.5 cm
Substituting these values into the equation gives:
So, the volume of the ice cube is 9 cm3.
Alternatively, you could start by converting the length, width and height to metres:
l = 3 cm = 3 10-2 m
w = 2 cm = 2 10-2 m
h = 15 mm = 15 10-3 m = 1.5 10-2 m
Substituting these values into the equation gives:
So, the volume of the ice cube is 9 10-6 m3.
Since 1 cm = 1 10-2 m, 1 cm3 = (1 10-2 m)3 = 1 10-6 m3 so the answers obtained by the two methods are equivalent. An answer of 9 000 mm3 is also acceptable.
- b.The largest recorded iceberg in the Northern Hemisphere was approximately rectangular in shape with a length of 13 km, a width of 6 km and an average height of 125 m. What is the volume of the iceberg?
where V is volume, l is length, w is width and h is height. In this case:
l = 13 km
w = 6 km
h = 125 m = 0.125 km
Substituting these values into the equation gives:
So, the volume of the iceberg is 9.75 km3.
Alternatively, you could start by converting the length, width and height to metres:
l = 13 km = 13 103 m = 1.3 104 m
w = 6 km = 6 103 m
h = 125 m
Substituting these values into the equation gives:
So, the volume of the iceberg is 9.75 109 m3.
Since 1 km = 1 103 m, 1 km3 = (1 103 m)3 = 1 109 m3 so the answers obtained by the two methods are equivalent.
Now look at one final equation, which gives the volume, V, of a sphere of radius r:
where is a constant ( is the Greek letter pi, pronounced ‘pie’). The constant has a value of 3.141 592 654 (to 9 decimal places) but you don’t need to remember this as it is stored in your calculator – look for the button now! You can use Equation 13.4 to find the volume of any sphere anywhere in the Universe.
Equation 13.4 is more complicated than any of the other equations we have considered, so it needs a closer look. First, the multiplication signs have been omitted, i.e. the equation could be written as:
Also, note that the radius term, r, is cubed: the powers notation, already introduced for numbers and units, can be used for symbols too.
However, note that only the r is cubed, not the or the , so when you substitute values into Equation 13.4, you need to take care to calculate:
Raindrops are approximately spherical and they have a diameter of about 2 mm, i.e. a radius of about 1 mm. Using Equation 13.4, find the volume, in metre3, of a typical raindrop:
so
This is about 4 10-9 m3. Check that you can obtain this value for yourself, taking special care to cube both 1 10-3 and its units (m).
The Earth can be thought of as a sphere with a radius of 6.4 106 m. Use Equation 13.4 to find a value for the volume of the Earth.
Using Equation 13.4:
So, the Earth has a volume of about 1.1 1021 m3.
Question 13.2
Using Equation 13.4, what is the volume of a hailstone with a diameter of 1 cm? Write out your calculation in the style recommended in Section 14.5, showing each step of the calculation, and give your answer to one significant figure.
The diameter of the hailstone is 1 cm, so its radius is 0.5 cm.
So, the volume of the hailstone is 0.5 cm3 to one significant figure.
Alternatively, you might have started by converting the radius to a value in metres:
Substituting this value into Equation 13.4 gives:
The answers obtained by the two methods are equivalent. It is also reasonable to give a value for the volume of the hailstone in mm3 (500 mm3 to one significant figure).
14 Tips for tackling mathematical questions
14.1 Getting started
Many students struggle to answer mathematical questions in science modules. The following tips may help.
- Read the question carefully and make sure that you understand what you are being asked to do. There are a number of keywords (‘process words’) you should look out for, since they give clues as to what is expected. Some commonly encountered process words are explained in Table 14.1.
- Write down the values and equations that have been given in the question, and also write down what it is that you are trying to find.
- It can be helpful to draw a diagram of the situation.
- Think carefully about how you are going to get from what you have been told in the question to what you are trying to find. What other equations etc. might be useful? (Write them down too.) Try to devise a strategy for answering the question.
- Have the courage to start to answer a question, even if you can’t see how to get to the end. The way forward may become clear as you work. Even if you have to give up part-way through, you may get some marks for what you have written. Remember that in a typical science question involving a calculation, most of the marks are for the working, not the final answer.
| Process word | What you are required to do |
|---|---|
| evaluate | Work out the value of an expression. |
| calculate | Work out the value of a quantity from formulae or other information. You will be expected to give the correct units of the quantity you have calculated, and to state your answer to an appropriate number of significant figures. |
| simplify | Reduce an equation or expression to its simplest form. |
| plot | Draw a graph. You will be expected to choose appropriate scales for the axes, label the axes correctly (with units if appropriate) and to show individual data points. You may also be expected to draw a line of best fit to the data. |
| sketch (a graph) | Draw the general shape of a graph. You will be expected to label the axes, but not indicate numerical values on them (although it is usual to indicate the origin). You will not be expected to put any data points on the sketch, but merely to indicate the graph’s shape. |
14.2 Doing the calculation
- Write down your working carefully even if you intend to write it out again. Use full-sized pieces of paper, not scraps; this makes your working much easier to follow and you are less likely to make mistakes.
- When you substitute numerical values, take care with units, scientific notation and significant figures.
14.3 Taking care with units
- Make sure that the values you have been given are in units that are consistent with each other. For example, it doesn’t make sense to multiply one length given in mm by another length given in cm. It is easier to convert all values to the same unit (frequently the SI base unit) before doing a calculation.
- Each line of your calculation should include units as well as numbers.
- The units of your answer should be consistent with the units attached to the values you are using in the calculation. So, if you are multiplying three lengths, measured in metres, the units of the answer will be m3; if you are dividing a distance in m by a time in s, the units of the answer will be m s-1.
14.4 Does your answer make sense?
- Is your answer about the size you expected? If you were finding the volume of a cube with sides 1.57 m long, you would expect the answer to be between 1 m3 (1 m 1 m 1 m) and 8 m3 (2 m 2 m 2 m). If your answer was 3 870 m3, you would know that you had made a mistake.
- If you followed the advice in point 3 of Section 14.3 ‘Taking care with units’, the units of your answer should be consistent with any equation that you have used. If you were trying to find a speed (correct SI units m s-1) and your answer had units of m3, you would know that something had gone wrong.
- These checks won’t guarantee that your answer is correct, but they will frequently highlight when mistakes have been made.
14.5 Writing maths
- Always write down your working as well as your final answer. If you need to send your answer to your tutor, it will help them to see what you did right and (if you made a mistake) where you went wrong. Even if no one else looks at your working, writing it down will make it clearer to you if you need to refer back to the question later. Also, if your answer is written down in a methodical way you are less likely to make a mistake and more likely to get the correct answer.
- It is perfectly acceptable to write words of explanation in your answer – it doesn’t all have to be symbols and numbers!
- Remember that the symbol ‘=’ means ‘equals’ and should never be used to mean ‘thus’ or ‘therefore’. The symbol ‘’ can be used to mean ‘therefore’, or just write the word ‘therefore’ or ‘so’ in your answer. It can make a calculation clearer if you align the ‘=’ symbols vertically, to indicate that the quantity on the left-hand side is equal to or approximately equal to each quantity on the right-hand side. Figure 14.1 shows some examples of good and bad practice in the use of equals signs.
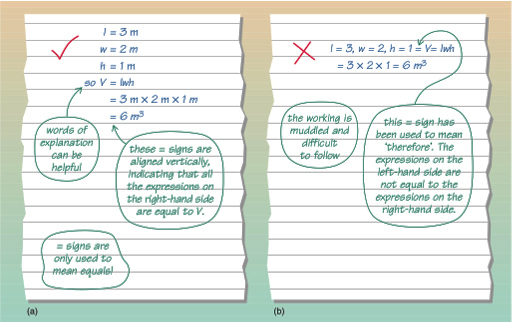 Figure 14.1 Using equals signs in calculations: (a) example of good practice; (b) example of bad practice.
Acknowledgement
This material was originally written by Sally Jordan, based in part on materials developed for the Open University module Discovering Science (S103). The production of this resource was supported by the Physics Innovations Centre for Excellence in Teaching and Learning (CETL).
Copyright © 2019 The Open University