11.2 Bar and column charts
Bar and column charts are used to summarise data in discrete categories, such as human eye colour, blood group, species of plant etc. The categories are listed along a reference line, usually a horizontal one (the so-called horizontal axis). The number or percentage of things or events falling into each category is represented by a bar, and the scale for these bars, most commonly expressed as a number or a percentage, is usually given on the vertical axis. The bars don’t have to be shown vertically; they can run horizontally. A chart with vertical bars may be called a ‘column chart’ but there is no other difference. Figure 11.5 shows a bar chart depicting the number of insect species supported by each of seven different types of tree in the UK. Notice that the bars on the bar chart do not touch; this is because each bar refers to a separate distinct category.
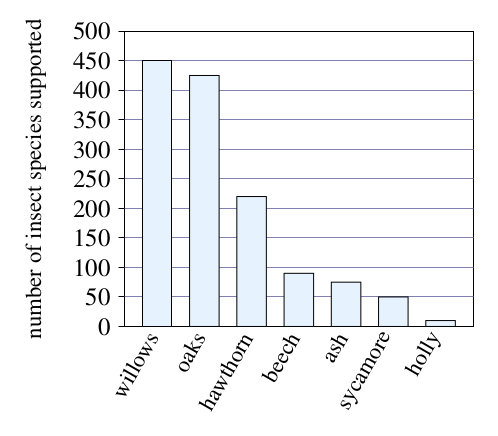
Roughly how many species of insect are associated with hawthorn?
Reading the value on the vertical axis, the top of the ‘hawthorn’ bar is just less than halfway between 200 and 250, so we can estimate that about 220 species of insect are associated with hawthorn.