11.2.1 Stacked bars and columns
The stacked bar or column chart shows how the total specified by the overall length or height can be broken down into two or more components. These are indicated in different colours or patterns, specified in the legend below the chart.
For example Figure 11.6 shows energy use in Denmark broken down into different fuels. The scale is marked in Petajoules (PJ).
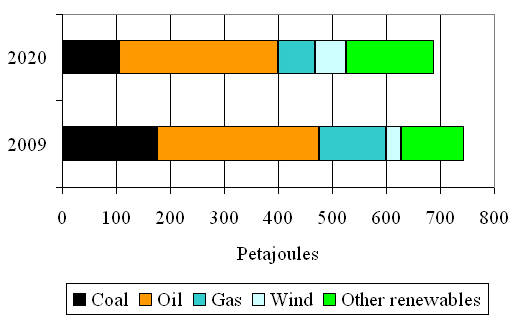
Figure 11.6 Primary energy consumption in Denmark in 2009 and a projection for use in 2020.
Roughly how many petajoules of energy from oil is Denmark projected to use in 2020?
The top bar shows data for 2020. Oil energy use is shown by the orange section. This runs from about 105 PJ at the left to 400 PJ at the right. So the energy use from oil is 400 PJ – 105 PJ = 295 PJ.