12 Representing data: graphs
12.1 Reading information from a graph
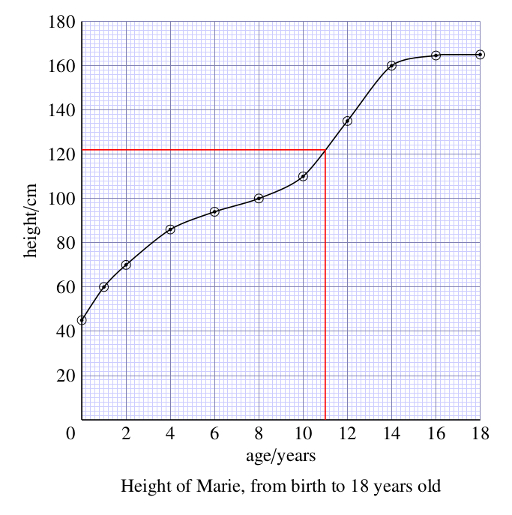
Graphs are used to illustrate the relationship between two quantities; for example Figure 12.1 shows the way in which the height of a girl changes as her age increases.
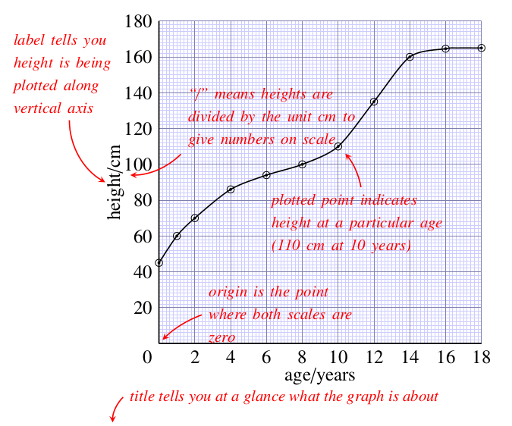
Figure 12.1 illustrates some very important points to be borne in mind when reading data from any graph of this sort.
Notice that the vertical axis has been labelled ‘height/cm’. The label includes the unit, in the same way as in the headings of tables. On some graphs the label includes a power of ten too – take care to look out for this.
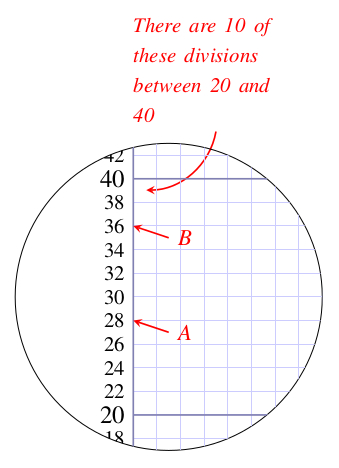
Returning to Figure 12.1, the combination of the label and the scale on the vertical axis tells us that the numbers correspond to height in centimetres, that is, 0 cm, 20 cm, 40 cm, etc. So as we move vertically upwards on the graph, the girl’s height increases by 20 cm for each 1 cm on the graph paper. Look at Figure 12.2, which shows an enlarged version of the small section of the vertical scale between 20 and 40 cm on Figure 12.1. Because the horizontal lines on the graph in Figure 12.2 are equally spaced, we can work out what values of height correspond to each of the lines. The 20 cm difference between 20 cm and 40 cm has been divided into 10 small equal divisions, so each small division represents = 2 cm. So the horizontal lines on the enlarged graph have been marked 22, 24, 26, and so on. The point on the axis indicated by arrow ‘A’ corresponds to 28 cm, and the point indicated by arrow ‘B’ corresponds to 36 cm. A point that is halfway between the lines marked 34 and 36 corresponds to 35 cm.
The horizontal axis in Figure 12.1 has a scale numbered 0, 2, 4, 6, …18; these numbers correspond to the age in years. The successive numbers are separated by 1 cm, so this is also a uniform scale. For every 1 cm that we move from left to right on the graph, the age of the girl increases by 2 years.
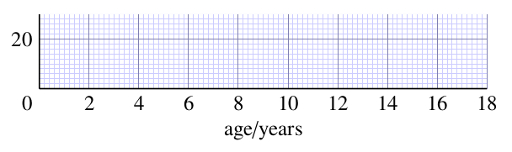
How much does the age of the girl increase for each small division?
Since 10 small divisions represent 2 years, one small division (1 mm) represents = 0.2 years. This is about 10 weeks.
The combination of title, axes, axis labels, scales and graph paper give a framework for displaying the results of measurements, and these are represented by the circled points on the graph in Figure 12.1. The position of a point on the graph represents a pair of related measurements; the horizontal position of a point represents the girl’s age, and the vertical position corresponds to her height at that age.
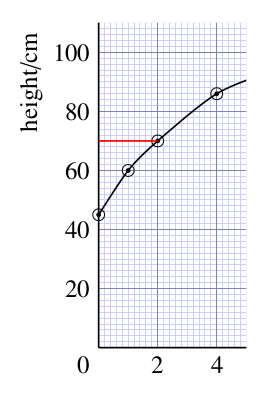
To work out the height for a particular point, you can draw a horizontal line from the point to the vertical axis, and read off the appropriate number from the scale.
What is the height for the third point from the left on the graph in Figure 12.1?
70 cm; you can find this value by drawing a line horizontally from the third point to the vertical axis.
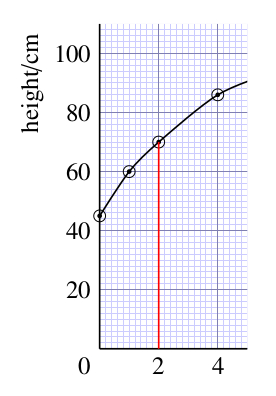
The corresponding age is read by drawing a line vertically downwards from the point to the horizontal axis.
What is the age for the third point from the left in Figure 12.1?
2 years; you can find this value by drawing a line vertically downwards from the third point to the horizontal axis.
An alternative to drawing lines on the graph is to lay a ruler on the graph, horizontally or vertically, to help your eye follow a line from a point on the graph to the axis.
The 11 circled points on the graph represent measurements of the girl’s height at different ages. The points have been joined together with a smooth curve to represent the overall trend of the measurements, and this gives an immediate visual picture of how the height has changed.
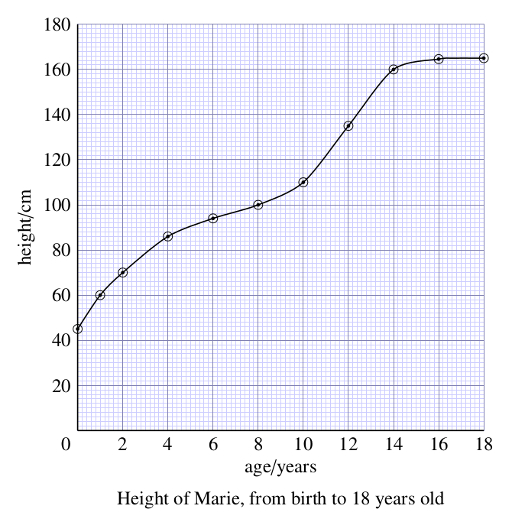
What is the trend of the girl’s height with increasing age?
The girl’s height increased rapidly in the first couple of years, and her growth then slowed down – the curve becomes flatter. There was another growth spurt corresponding to the onset of puberty, between 10 and 14 years, and her height then remained almost constant at about 165 cm. (This last height is 2 divisions above160 cm, and since each division is 2 cm, the height must be 2 2 cm = 5 cm above 160 cm.)
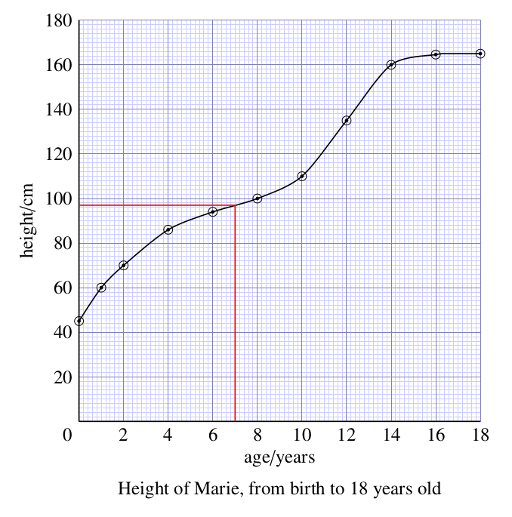
The smooth curve allows us to estimate the height of the girl at ages between those at which the actual measurements were made. So to estimate her height at 7 years, we find 7 years on the age axis, follow a vertical line upwards from here to the curve, and then follow a line from this point on the curve to the vertical axis, and read the appropriate value for the height from the scale on the axis; it’s about 97 cm. This process of determining intermediate values between the plotted points is known as interpolation.
Question 12.1
Use the graph to estimate the girl’s height at 11 years.
Following a vertical line upwards from 11 years on the horizontal axis to the curve and then following a horizontal line left from this point on the curve to the vertical axis gives a value of approximately 122 cm.
Question 12.2
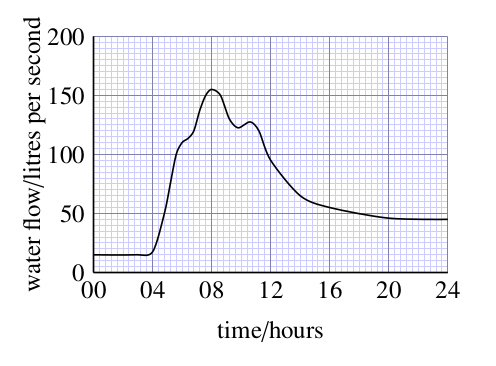
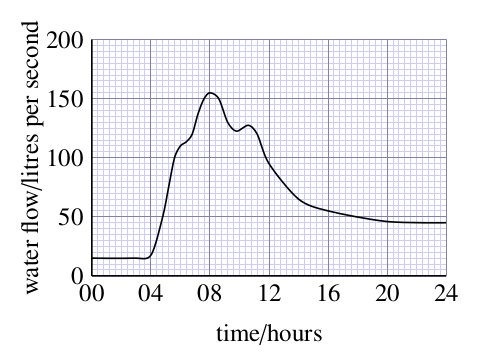
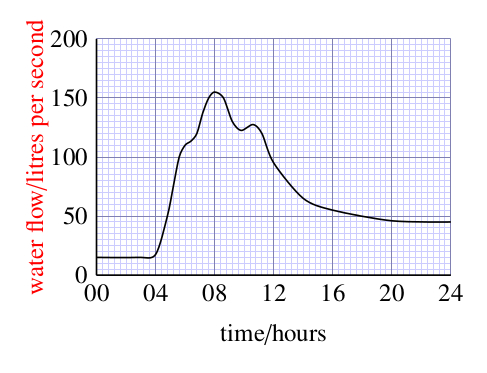
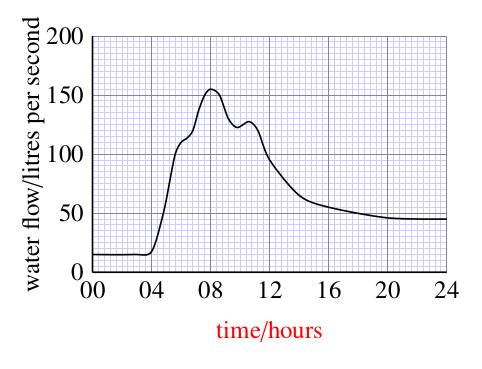
To practise reading graphs, study Figure 12.3 and answer the following questions.
- a.What is the subject of this graph?
The subject of this graph is the volume of water flowing each second past a point in a stream after heavy rain. (The title or caption is usually the best place to find out what a graph is showing.)
- b.What quantity is plotted on the vertical axis, and in what unit is it measured?
Water flow, measured in litres per second, is plotted on the vertical axis.
- c.What is plotted on the horizontal axis, and in what unit is it measured?
Time is plotted on the horizontal axis, and this is measured in hours. (The 24-hour clock has been used, so the period covered is 1 day.)
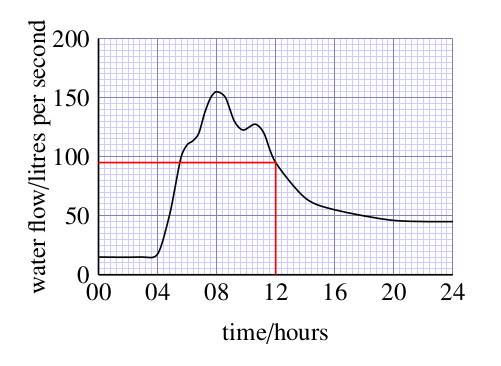
- d.What was the water flow of the stream at 12.00 hours?
At 12.00 hours, the water flow was about 95 litres per second. (Found by following a line vertically upwards from 12.00 hours to the curve, then following a horizontal line left from this point on the curve to the vertical axis and reading from the scale. In this case, the line intersects the scale one division below 100. Since 10 divisions correspond to 50 litres per second, 1 division corresponds to 5 litres per second, and so the flow is (100 – 5) litres per second, or 95 litres per second.)
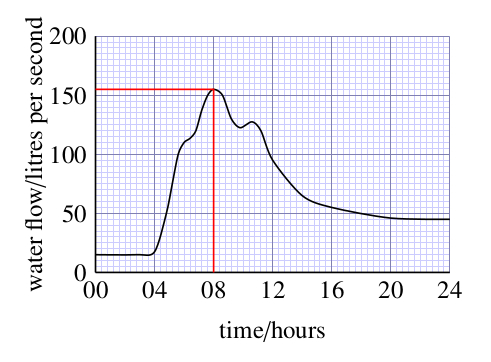
- e.What was the maximum flow of the stream and at what time did it occur?
The maximum flow was about 155 litres per second, and this occurred at approximately 08.00 hours. (The maximum flow corresponds to the peak of the curve; by drawing horizontal and vertical lines from the peak to the axes you can read off the flow and the time respectively.)
- f.Describe in words the way that the water flow changed over the period plotted on the graph.
The flow was steady until 04.00 hours, and then it increased very rapidly for about two hours. After this it increased more slowly until it reached a maximum flow at 08.00 hours. It then started to decrease; there was a small peak at about 11.00 hours, and the flow gradually decreased until it became fairly steady after 20.00 hours, at a greater flow than at the start of the day.