Once upon a time there were two spies, code-named M and N, who worked for rival departments.
By coincidence on one particular day M and N were both assigned to 24-hour surveillance of the email messages sent by a dastardly counterspy X to one of her accomplices Y.
The messages were cunningly encrypted, so the content was unreadable, but it was hoped that monitoring the number of communication would indicate whether or not a crisis was looming and action would need to be taken.
A downward trend during the day would indicate there was no cause for alarm; conversely an upward trend would indicate danger.
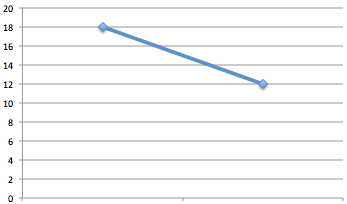
M counted the messages sent in each 12-hour period and submitted a report with a graph showing a clear downward trend.
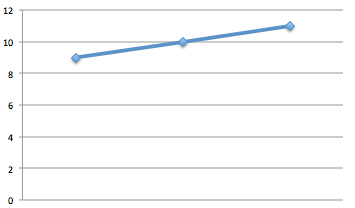
N counted the messages sent in each 8-hour period and submitted a report with a graph showing a clear upward trend.
Yet the equipment used by each spy was perfectly reliable, and they recorded the data accurately. How can this paradox be explained?
Comments
New comment
Assuming they measured the same 24 hour period, one got results of 18 and 12 messages, the other got 9, 10 and 11 messages. Both saw 30 messages in total.Let us say the period was midnight to midnight.
The problem is caused by having too few data points if the crisis measurement was an hourly check. Or the problem was caused by having too little data if the crisis management was day-by-day.
If the crisis was as finely tuned as hourly, it probably happened in the 08:00 to 12:00 period.
A similar effect happens when measuring audio or radio frequencies. You must take samples far more often than than the cycle of the signal. If you take samples every second for something slightly faster or slower than once per second, it will appear to be a cycle of many seconds or even minutes.
I reckon the sampling periods were incorrect.
New comment
Actually, two data points and drawing a conclusion? If unemployment was 2 million last year and 1.5 million this year, it will be zero in 2019 and minus 500,000 in 2020. It was dark at midnight and bright at mid-day so by next midnight it will be dazzling and midnight tomorrow the sun will be blinding.
You can't draw much of a conclusion from two data points.
New comment
I assumed that they were different time periods too, especially as the x axis had no markings. Graphing is one of my weaknesses.