The ‘Vision’ thing in Learning Analytics: Activity 22 Block 4
Thursday 16 June 2016 at 16:29
Visible to anyone in the world
Edited by Steve Bamlett, Thursday 16 June 2016 at 16:55
The task
requires you to consult Table 4 from Dyckhoff et. al, (2013:226). Here is a Powerpoint
version:
·In a blog post, or in your learning journal, combine or develop some of
these goals to construct a vision of what learning analytics could be at your
institution or at one you know well. Aim for a vision statement that is no
longer than two sentences.
·Once you have constructed a vision, note whether it seems to be a
learner’s vision, an educator’s vision, a manager’s vision or a combination of
these. How would it need to change, if at all, to inspire other stakeholder
groups?
It is not JUST that some of the goals here are ‘mundane’
that stops them being ‘visionary’ for me but that they fundamentally fly in the
face of what I believe:
1.learning
to be, and;
2.the
function of an ethical and value-driven pedagogy.
For instance, let’s take the axiom ‘learners are supposed
to compare own behaviour with the whole group
/ high performing students’.
For me, any learning that derives
primarily or only from such a process is likely to be, if anything, a step
towards an act of learning rather than learning itself. Learning that emerges
from social comparison is, of course, a kind of learning – the kind of imitative
achievement that Koko the gorilla was
adept in – but, in its most serious articulation (Bandura’s notion of
‘modelling’) it is a complex beginning of a learning process based on many more
social, psychological and bodily feedback processes than are comprehended in
the initial act of imitation itself. This is why, I believe, Laurillard’s (2012)
model of pedagogic process has to form so complex a visualisation.
Let’s put that aside however
and begin to envision. I’ve studied Table 4 carefully and come up with a visual
representation below. It shows a ‘learner’s, teacher’s and administrator’s vision
(of course grossly stereotyped – but I don’t know another way of doing this
task - of the potential of LA. Together they form a picture of a vertical
process through which these 3 eyes might become one in a grand bricolage.
The process could either be
TOP-DOWN, where the administrator’s vision and needs dominate, initiate
adoption of LA and offer it downwards. This is very like what is described in
Cluster 1 of the Australian Universities studied in Colvin et. al. (2015:19ff).
Or it could be BOTTOM-UP,
initiated by learner needs and aspirations. For me this is preferable and is
imagined in PEAR.
More probable is initiation
from pedagogy and involved both learners and administrators, creating end-goals
for each, not all of which formed part of the original vision.
Overall, the aim is to see
VISION as problematic as a front-loaded initiator of change that precedes any
consultation between stakeholders.
So that’s all for now.
All the best
Steve
Colvin, C., Rogers, T.,
Wade, A., Dawson, S., Gasevic, D., Buckingham Shum, S., Nelson, K., Alexander,
S., Lockyer, L., Kennedy, G., Corri, L. and Fisher, J. (2015), Student
Retention and Learning Analytics: A Snapshot of Australian Practices and a
Framework for Advancement: Final Report 2016, Australian Government: Office
for Learning and Teaching; also available online at http://he-analytics.com/ (accessed 15 June 2016).
Dyckhoff, A.L., Lukarov,
V., Muslim, A., Chatti, M.A. & Schroeder, U. (2013) ‘Supporting Action
Research with Analytics’ inProceedings of the 3rdInternational Conference on Learning
Analytics and Knowledge (LAK’13) 220 – 229.
Laurillard, D. (2012) Teaching as a Design Science:Building
Pedagogical Patterns for Learning & Technology New York, Routledge,
The ‘Vision’ thing in Learning Analytics: Activity 22 Block 4
The task requires you to consult Table 4 from Dyckhoff et. al, (2013:226). Here is a Powerpoint version: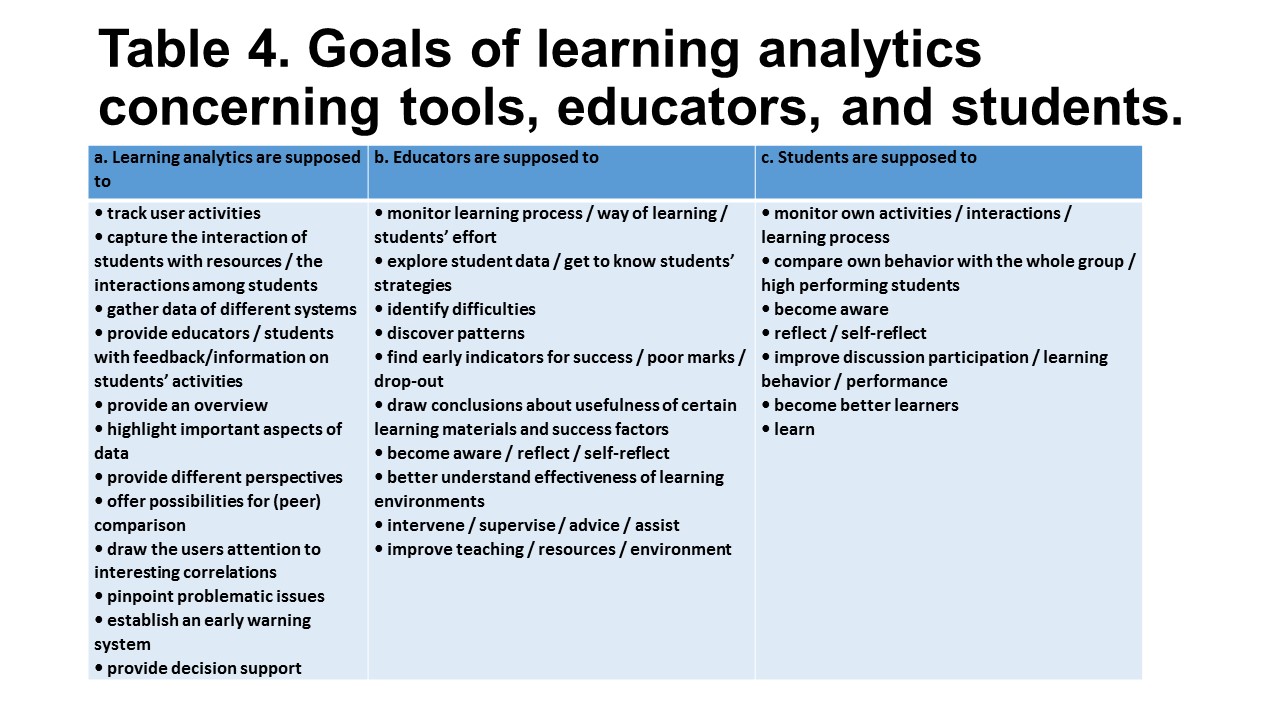
· In a blog post, or in your learning journal, combine or develop some of these goals to construct a vision of what learning analytics could be at your institution or at one you know well. Aim for a vision statement that is no longer than two sentences.
· Once you have constructed a vision, note whether it seems to be a learner’s vision, an educator’s vision, a manager’s vision or a combination of these. How would it need to change, if at all, to inspire other stakeholder groups?
It is not JUST that some of the goals here are ‘mundane’ that stops them being ‘visionary’ for me but that they fundamentally fly in the face of what I believe:
1. learning to be, and;
2. the function of an ethical and value-driven pedagogy.
For instance, let’s take the axiom ‘learners are supposed to compare own behaviour with the whole group / high performing students’.
For me, any learning that derives primarily or only from such a process is likely to be, if anything, a step towards an act of learning rather than learning itself. Learning that emerges from social comparison is, of course, a kind of learning – the kind of imitative achievement that Koko the gorilla was adept in – but, in its most serious articulation (Bandura’s notion of ‘modelling’) it is a complex beginning of a learning process based on many more social, psychological and bodily feedback processes than are comprehended in the initial act of imitation itself. This is why, I believe, Laurillard’s (2012) model of pedagogic process has to form so complex a visualisation.
Let’s put that aside however and begin to envision. I’ve studied Table 4 carefully and come up with a visual representation below. It shows a ‘learner’s, teacher’s and administrator’s vision (of course grossly stereotyped – but I don’t know another way of doing this task - of the potential of LA. Together they form a picture of a vertical process through which these 3 eyes might become one in a grand bricolage.
The process could either be TOP-DOWN, where the administrator’s vision and needs dominate, initiate adoption of LA and offer it downwards. This is very like what is described in Cluster 1 of the Australian Universities studied in Colvin et. al. (2015:19ff).
Or it could be BOTTOM-UP, initiated by learner needs and aspirations. For me this is preferable and is imagined in PEAR.
More probable is initiation from pedagogy and involved both learners and administrators, creating end-goals for each, not all of which formed part of the original vision.
Overall, the aim is to see VISION as problematic as a front-loaded initiator of change that precedes any consultation between stakeholders.
So that’s all for now.
All the best
Steve
Colvin, C., Rogers, T., Wade, A., Dawson, S., Gasevic, D., Buckingham Shum, S., Nelson, K., Alexander, S., Lockyer, L., Kennedy, G., Corri, L. and Fisher, J. (2015), Student Retention and Learning Analytics: A Snapshot of Australian Practices and a Framework for Advancement: Final Report 2016, Australian Government: Office for Learning and Teaching; also available online at http://he-analytics.com/ (accessed 15 June 2016).
Dyckhoff, A.L., Lukarov, V., Muslim, A., Chatti, M.A. & Schroeder, U. (2013) ‘Supporting Action Research with Analytics’ in Proceedings of the 3rd International Conference on Learning Analytics and Knowledge (LAK’13) 220 – 229.
Laurillard, D. (2012) Teaching as a Design Science:Building Pedagogical Patterns for Learning & Technology New York, Routledge,