It is well known that artificial intelligences may sometimes generate what are called hallucinations. Presumably, this is because an AI will always try to generate a response, and if it doesn't have much information to go on, what it produces may be unreliable.
Thinking about this phenomenon reminded me of something I experienced a decade or so ago. As a result of the sudden loss of part of my visual system, I began seeing visual hallucinations—a condition known as Charles Bonnet Syndrome (CBS), named after Charles Bonnet, who wrote the first description of it. As I’ll explain later, this is thought to happen when a group of neurons in the visual system suddenly lose their input signals and begin inventing what the late Oliver Sacks called ‘figments’. This provides an interesting parallel with AI-generated hallucinations; in both cases, the system is doing its best to come up with something in spite of there not really being enough information.
Many people who are blind or visually impaired experience these hallucinations. They are not psychotic symptoms, as the affected individuals are completely aware that what they are seeing is an illusion and nothing more.
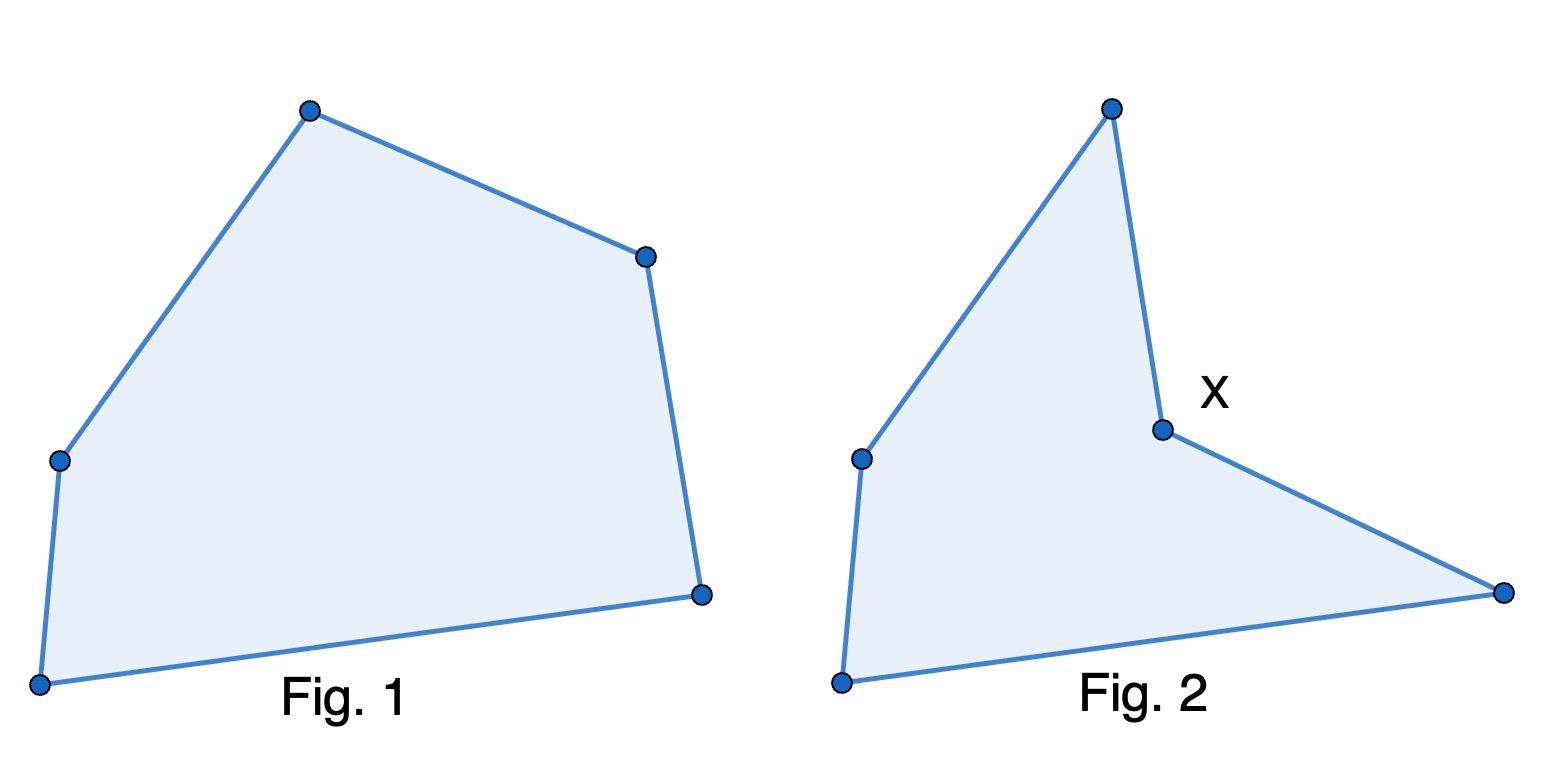
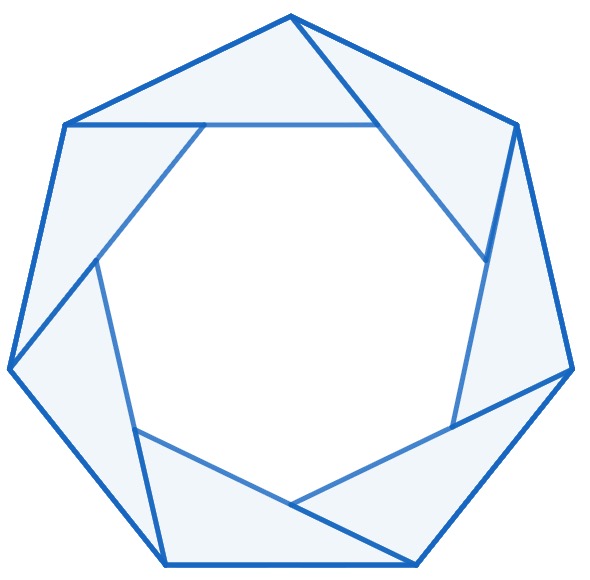
The hallucinations may be ‘unformed’, such as abstract shapes like triangles or hexagons that do not represent real experiences. They may also be ‘formed’, which means they correspond to things the patient has actually seen in their visual field, for example, their own arm.
I had CBS for about a month and saw, among other hallucinations, triangles, squares, hexagons, cube frameworks, flags, herringbone patterns, Buckyballs, chequerboards, packs of running dogs, groups of sprinters, a Cheshire cat, Homer Simpson, my own face but strangely plasticised, a miniature version of myself diving into a vortex, mathematical tables, structural molecules, and a white horse crossing the road in front of me.
However, these are but a shadow of what some patients experience. Some examples are buildings, landscapes, carriages, groups of people trooping up and down stairs, and many other scenes far more complex than anything I witnessed.
The hallucinations come and go suddenly, and they are silent and do not interact with the viewer in any way: they go about their own business, whatever that may be, with complete indifference to the patient. Moreover, patients are always aware that they are experiencing hallucinations, never imagining the phantoms have any reality.
What is going on, and why are similar themes (such as cartoon characters or hexagons) seen by a large proportion of CBS sufferers? Oliver Sacks put forward the following theory, which I have summarised to the best of my ability.
Studies using functional magnetic resonance imaging, which can reveal patterns of blood flow in the brain in real time, indicate that there is a level of the visual cortex in which very specific patterns are recognised. Many particular groups of neurons exist whose job it is to react to shapes or lines or faces or cartoon characters—and not just cartoon characters in general, but a particular one, Marge Simpson, say. This suggests the existence of 'square neurons' or 'hexagon neurons'—a deeply intriguing concept.
Without the sight loss, these neurons would respond to real-world stimuli, and the responses would be integrated by the higher visual cortex into a normal view of the world. But presumably, when they receive no incoming signals, they begin to fire at random; the swirling phantoms this produces are experienced as hallucinations. The peculiar nature of what CBS sufferers see is due to the fact that the neurons are so specific.
Studies suggest that the prevalence of CBS among elderly people with sight loss may be up to 40%.
The consensus is that this figure is heavily under-reported because sufferers are afraid to speak about what they are seeing, fearing that others will think they are losing their minds and that they will be stigmatised.
However, things have improved a great deal in recent years. CBS is recognised in new clinical guidelines, clinicians inform and reassure patients, and several support networks now exist.