I'll begin by saying what the Three Gap Theorem is. I'll show some examples and then explain a simple way you can play with the theorem using only paper and pencil. After that I'll outline the theorem's history, and lastly I'll explain how the graphics were produced
Theorem
Draw a circle and mark a point anywhere on its circumference. Then choose an angle and rotate the point through that angle about the circle's centre.
Mark this point, then repeat the process, using the same angle, to get a third point. Carry on in this way, always rotating the current point through the same angle to get the next point.
Eventually the total angle travelled will exceed a full turn and the circle will be traversed a second time. As long as the angle chosen was not a simple fraction of a whole turn, the new points will not coincide with existing points but be new points, each splitting the gap between two points that were formerly adjacent into two smaller gaps.
We can carry on indefinitely and each time we go round the circle again new points will split existing gaps into gaps of smaller size. This will lead to an increasingly complex situation and we naturally expect each successive snapshot to contain more and more different gap sizes
But it doesn't!. The number of distinct gaps is only ever two or three, never more. Moreover if the number of gap sizes is three, the size of the largest gap will be the sum of the other two gap sizes.
This is the Three-Gap Theorem.
Examples
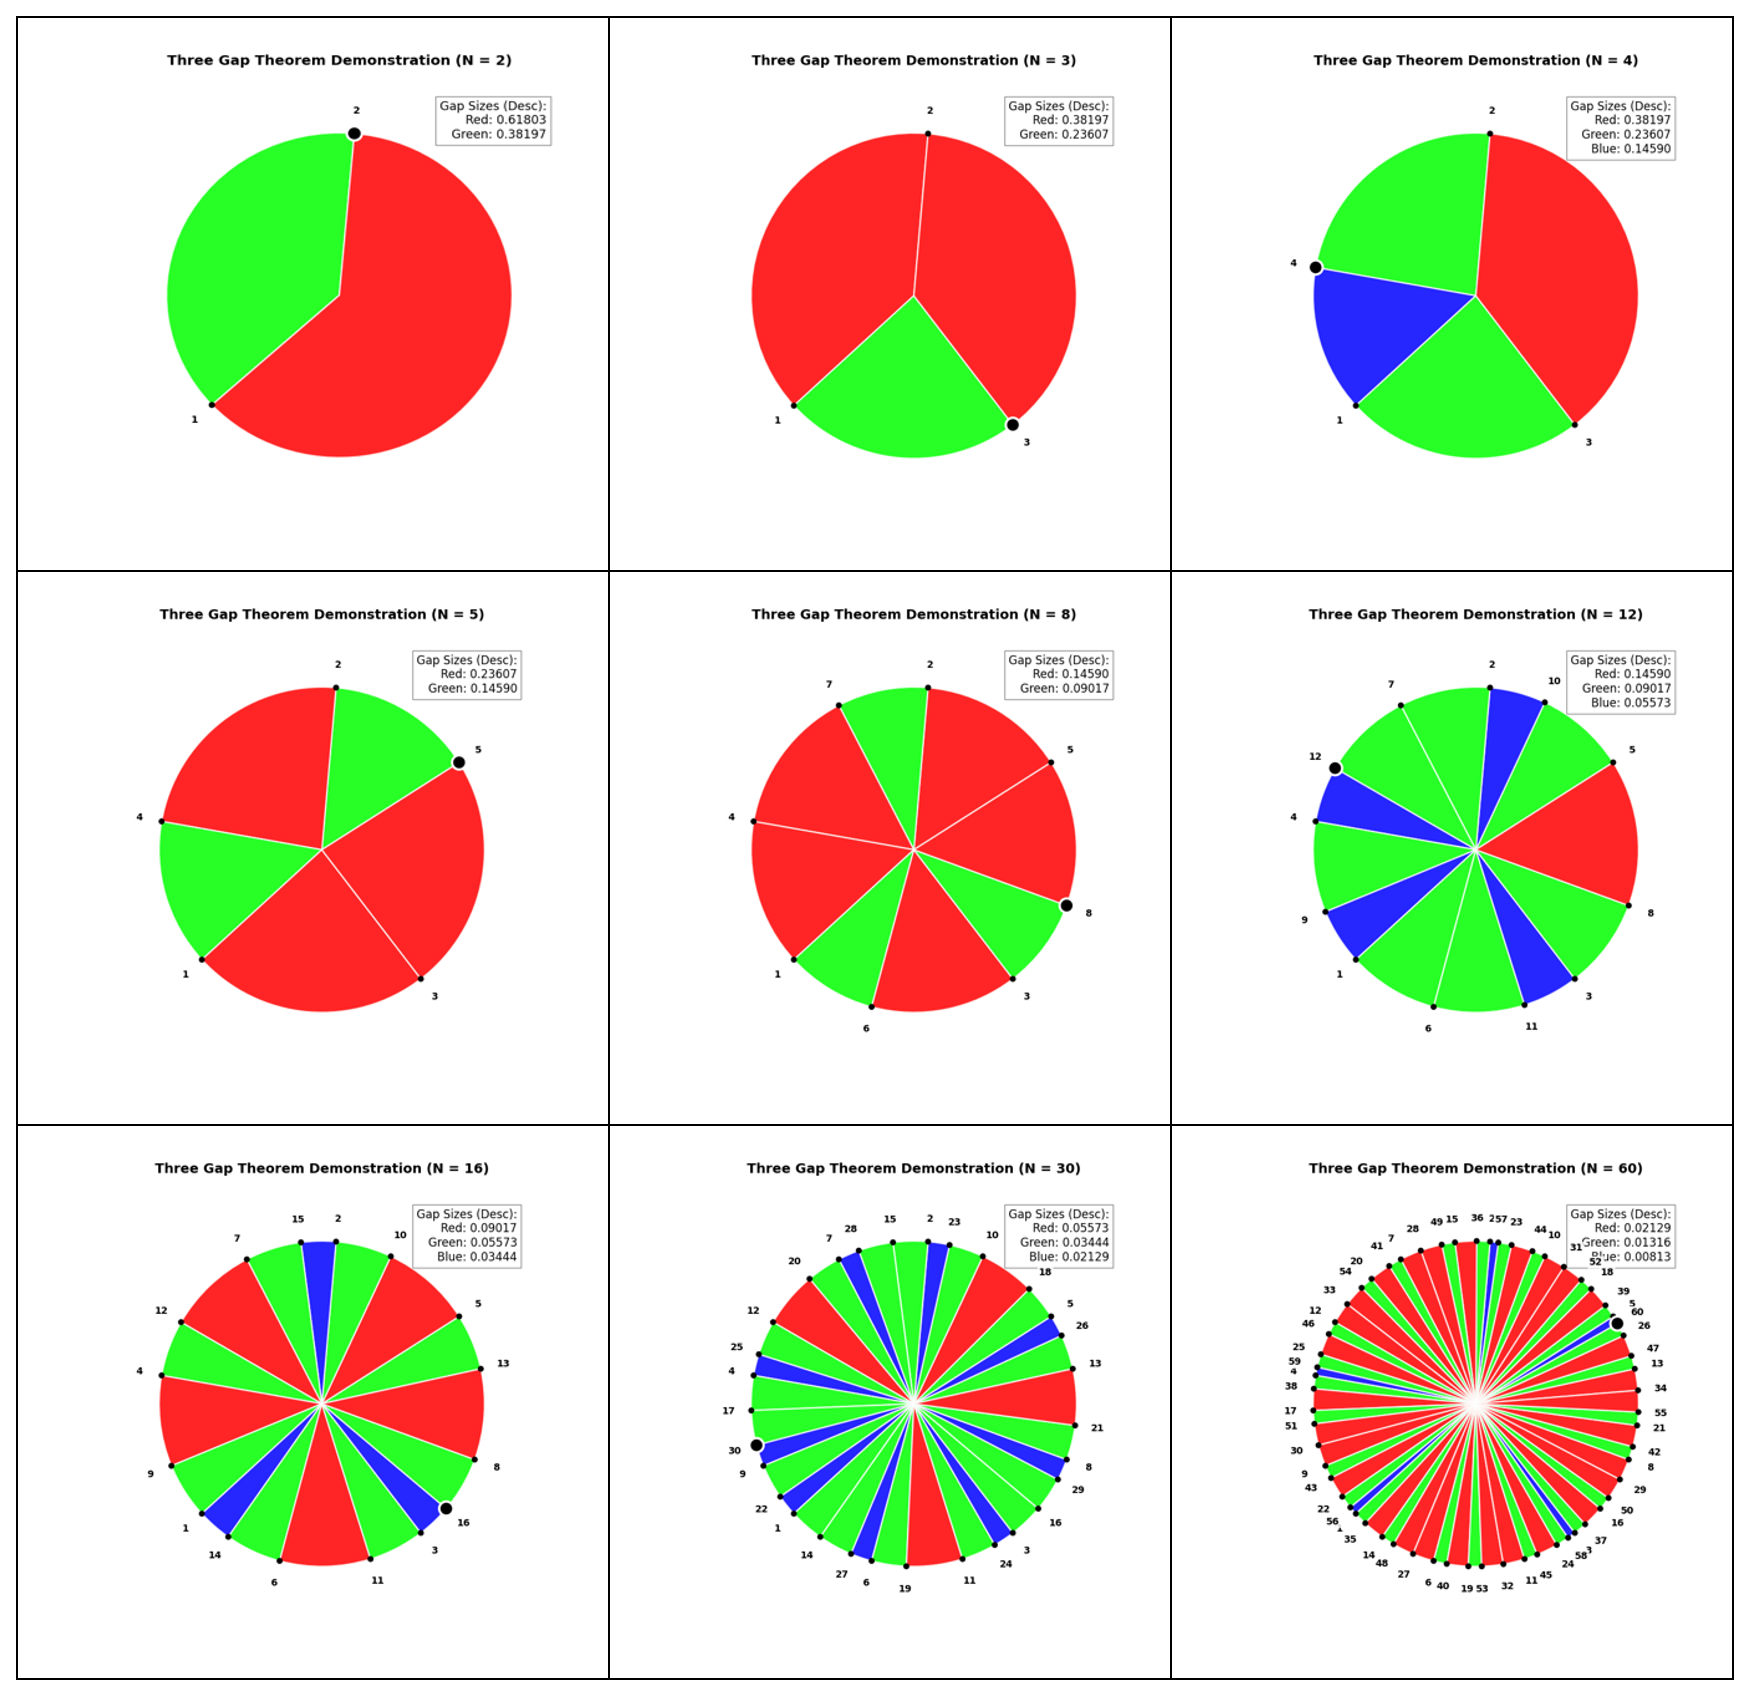
These examples were generated by a Python program which I 'll say more about later. If you zoom the browser in you can see the number of points I stopped at in each and the gap sizes in decreasing order. It's interesting that, for example, from 3 to 4 points increases the number of gap sizes from two to three, but then from 4 to 5 it drops to two again. Another interesting feature is that in every case there appears to be a two-fold symmetry.
History
The behaviour of the gaps was described by the noted mathematician Hugo Steinhaus in 1957 but he only conjectured that the number of distinct gaps never exceeded three. The theorem was first proven in 1958 by Sós, Surányi and Świerczkowski, and since then different proof have been found, although none that seem to me very simple. The area is still the object of active research; for example I believe the two-fold symmetry was provem fairly recently and at least one researcher is studying whether generalizations exist to e.g. three dimensions.
Pencil and paper investigation
You don't need anything complicated to play around with these gaps, just pencil and paper. I drew a circle round a large cup, then marked made two marks on a strip of paper and stepped off the points round the circle., which as easy to do and worked quite well I felt.
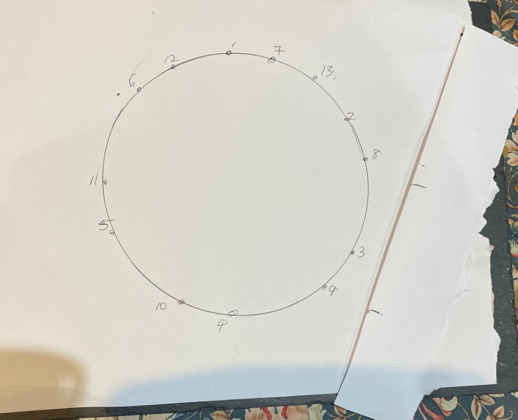
You can see three distinct gap lengths. I think Steinhaus must have been playing around in a similar way when he made his discovery, don't you?
Computing
I'd never heard of thie Three Gaps Theorem until a few days back, but when I stumbled across it, I thought it was really surprising and fascinating. So first I knocked up a quick and dirty Python program, which simulated moving round a circle in same size steps as described above. Once I had made a list of the points I calculated the gaps and sure enough there were only two numbers. After I tweaked the numbers a bit I managed to get three numbers sometimes, but never more. So my experiments seemed to corroborate the theorem.
But I wanted something a bit more dramatic to illustrate it and although I once wrote a Python program to draw pie charts doing it all myself by hand requires too much heavy lifting and so I asked 'Google AI' to produce a program. I was very specific about what I wanted and I spelt out things like the colours and what we were trying to simulate. The AI was aware of the theorem so that helped a lot.
I asked for a legend that would list the gap sizes and specified that I wanted the gaps shown by 'pizza slices', i.e. coloured sectors, because I thought would stand out a lot better than just using differently coloured circular arcs
On the first attempt, the AI made a mistake and we got a Python error so I told it what the error message was and it diagnosed what had done wrong and corrected it and now it worked.
However the colours were a bit wishy-washy and I wanted something a bit more dramatic so I managed to get it to change the colours and then I had the program that generated the pictures that I've shown earlier in this post.
I thought the AI did a good job and it wrote code in a couple of seconds that would've taken me probably a couple of hours at a minimum so I thought as a productivity aid it was quite impressive. I thought it is very interesting that it not only corrected its mistake, but explain to me what it had done wrong.
I hope you found this introduction to the Three Gap Theorem interesting, and if you've done the pencil and paper exercise, you may have got some intuition about why the theorem is true.
That's very far from a proof of course, and at the moment I didn't feel that I understood any proof well enough to try and sketch it out in a block post, but I'm working on it. Hopefully, I'll be able to come up with something accessible and convincing!

