OU blog

Personal Blogs

Design Museum

H809 Activity 7.3 First part of the Conole et al. paper

Visible to anyone in the world
Edited by Jonathan Vernon, Tuesday, 26 Mar 2013, 06:57

Activity 7.3: Reading the first part of the paper (2 hours)

Read the first part of the Conole et al. paper through to the end of section 1, ‘Introduction’ (pp. 17–21).

As you read the paper note the different purposes the authors envisage for their model. Then consider and make notes on the following questions:

  • Who do the authors see as the main audience for this paper?
  • What is the main aim of the paper?

Try to fit the readings met so far in the module into Table 1 of the Conole et al. paper.

The main audience of the paper would appear to be fellow academics of tertiary education and postgraduate students of the same with a particular interest in e–learning. This might include PGCE students, teachers and educators, learning designers and e–learning designers. The main aim, purpose or outcome of the paper is to provide insights and practical skills, to isolate and match theories and application so putting theory into practice and allocating theories to design decisions and choice indicating implications, objectives and choices. Models help to Visualise and clarify.

The dichotomy suggested as existing between reflection and non-reflection is a false one.

We reflect on everything we do in our subconcious whether we like it or not otherwise we'd be dead. This is what is going on when REM is observed in our sleep - our brains are going through stuff, mixing it up with and across some 15 parts of the neuronal network and slowly turning a short term thought into a long term memory. Or some such, I'm neither a neuroscientist nor a psychlologist.

By stating non-reflection the authors may be suggesting this is a conscious decision not to do a formal exercise of reflecting. We can't, as I said, turn our brains off.

The 3D model doesn't work for me while the 2D do.

Three years of reading Conole and I still find some of her visual conceptions hard to comprehend, bucking the trend or coming from a conceptualisation of the world that I don't get - or reinvention where it isn't necessary. I recall the triangle of Vygotsky and Activity Theory by Engestrom transmogrified into a diamond.

There is a good reason for a copywriter and art director to sit together in the creative department of an advertising agency - one words, the other visuale. It is rare for a person to be good at both.

1) Hiltz and Meinke (1998) Virtual Classroom in a traditional setting. Behaviourist/Cognitive leaning towards constructive where content can be viewed and reviewed at leisure. Experiential in 'suck it and see' what happens from the research point of view.

2) Wegerif and Mercer (1997) Computing to analyse large amounts of text. Socially–situated and Activity Theory / Experiential.

3) Laurillard (1994) A conference presentation where others listen and observe - both the presenter and the slides they show. Behaviourist. Didactic. 'Telling' in a lecture.

4) Oliver et al (2007) A chapter in a book. Written for academics and students to read.Behaviourist. Didactic. Read our wise words as an absolute. Constructively formed via a peer–reviewed paper. Two authors collabirating.

5) Rouen and Eliahu (2000) is a conference presentation too, financed by the Centre for Education. Behaviourist. Didactic. 'Telling' in a lecture. Constructed between the authors.


Permalink 2 comments (latest comment by Jonathan Vernon, Sunday, 24 Mar 2013, 22:49)
Share post
Design Museum

Neil Gower Illustrator - Inspiration for visualisers

Visible to anyone in the world

Neil Gower illustrator talking about design a cover for Lord of the Flies and flicking through his sketch pad.

Inspiration for visualisers


Permalink
Share post
Design Museum

Social Media Communications visualised

Visible to anyone in the world
Edited by Jonathan Vernon, Thursday, 26 May 2011, 16:59

There's no science behind any expression of how we learn or how we communicate - how this occurs online can be hijacked by a myriad of metaphors from leaves to digital oceans.

 DSC01802.JPG

All I'm trying to do here is share with others my take on social media and a simplistic impression of how it is different from 'old media' in that the communications comes from within an organisation lopping off the middle men and the hierarchies that can get in the way.

Here's another one I tried

DSC01801.JPG

Do please say what you think or other a sketch of your own.

Permalink Add your comment
Share post
Design Museum

Visualising the learning design process

Visible to anyone in the world
Edited by Jonathan Vernon, Wednesday, 23 Jan 2013, 06:07

Visualising the process and products of learning design

I will be at CAL ’09 next week in Brighton, and am looking forward to it, in particular some of the sessions and papers which include work from the JISC Curriculum design call. For example, the “challenges of the design pattern paradigm” session and other learning design papers/session. In the meantime I thought I’d put up the poster that my colleagues and I have put together, This poster  entitled “Visualising the process and and products of learning design” will be presented at CAL ’09.

It  is a very short synopsis of the visualisation and representation work we’ve been doing here at the OU. A  version of the poster itself is available for download (click on the image to see a low resoultion image of the poster, or on one of the  links to see a higher resolution PDF at either A4 or A0 size):

Image showing “Visualising the process and and products of learning design ” poster

Visualising the process and and products of learning design, A0 sze (pdf, 1.9 Mbyte),

Visualising the process and and products of learning design, A4 size (pdf, 1.1 Mbyte).

Also, a draft of the text of the poster (including the abstract and references) is available here.

Can visual representation work at the curriculum level?

Apart from the design patterns and learning design stuff, one of the other things I would like to explore whilst at the conference is if or how visual representations have been used at programme level (or above). As far as I’m aware, most visual representation work has focused on the activity or course level, and describes interactions involving students and teachers.  But what about the curriculum level? I’m keen to talk to anyone working in this area: please do  contact me if you are, or add a comment below, thanks <img class=" src="http://www.open.ac.uk/blogs/brasherblog/wp-includes/images/smilies/icon_smile.gif" />

CAL ’09 poster text

Abstract

Teachers and media developers go through a complex decision making process when designing new learning experiences – working towards an effective pedagogical mix, combining resources, tools, student and tutor support. For an individual media developer or teacher, the process of creating a visual map of a learning activity clarifies their own understanding of the mix. For teams comprised of individuals focused on different aspects, a visual representation supports communication about issues that need to be resolved before the activity is delivered to students.

This paper focuses on the development of CompendiumLD, a particular strand of work within the OU Learning Design Initiative. CompendiumLD is a tool to represent and visualise learning designs; it is an adaptation of Compendium, an existing knowledge mapping tool. CompendiumLD has been developed iteratively, informed by evidence gathered through a series of interviews with academics, and tested through a series of faculty based workshops. Development has proceeded from changes in the set of icons used to represent components of learning activities, through to specific functionality to support the design of learning activities. This functionality includes context specific learning design help and a set of visual design templates.

Findings to date indicate that most users find the tool easy to use, that it makes the process more explicit and provides a useful vehicle for sharing design ideas with others. Some users are interested in its potential to support both the process of learning design and the production of maps for use by students.

Recently introduced  features include (1) the facility to specify times that students and tutors will spend on specific tasks, producing a running total displayed on the user interface and (2) support for transclusions (intended to help designers  identify reuse of  e.g. tasks or learning objectives. Initial evaluations of these new features will be discussed.

1       Introduction

A learning activity can be conceptualised as a specific interaction of learner(s) with zero or more other(s) using specific tools and resources, orientated towards specific outcomes (Beetham, 2007).  Evidence we have gathered indicates that designing learning activities is inherently messy, creative and iterative, and that choosing  the best combination of tools, resources and tasks for a particular context is difficult (Conole et al., 2008). In the Open University and other distance universities, design is typically carried out by teams composed of people with a variety of specialist skills including academics, programmers, graphic designers, editors and project managers.

2       Aims

Our aim is to research, design and implement a range of tools to support individuals to design effective learning activities, and to enhance the effectiveness of design teams.

One approach we have taken is to apply the concept of ‘knowledge cartography’  to learning design, building on previous work in this area including other visual representations of learning designs (e.g. UML activity diagrams, LAMS).  This has led to the development of a software tool CompendiumLD through which we are exploiting two aspects of mapping, the product and the process.

  • As products maps can visually represent complex relationships between objects, which highlight key elements and connections for a particular purpose
  • Creating a map forces a person to externalise their understanding of the situation, and this process clarifies their understanding of the situation

(Okada, Buckingham Shum, & Sherborne, 2008).

Design processes

In our research  to date we have studied how design  is carried out by individuals and teams within the iterative design cycle which occurs before courses are launched.

We will be studying how CompendiumLD can be used by teachers to  deliver teaching activities, and how it can be used to evaluate the design of activities.

Design products

Snapshots from the design process

The learning design nodes are on the left hand side: these can be dragged and droped onto the working area. Learning design nodes include

Learning activity

Learning outcome

The nodes can be connected by dragging between them.

Double-clicking on a learning activity opens it

A screen grab of CompendiumLD showing the main working area labelled  “Andrew Brasher’s Home Window”.

Context sensitive prompts appear when nodes are added.

3       Evidence

Empirical evidence gathered to inform the development of CompendiumLD  includes the collection of user requirements (Nixon, 2007), case studies (Wilson, 2007), 12 semi-structured in-depth interviews, and evaluation of workshops and focus groups (Cross, 2008). In January 2009 we began in-depth evaluation of holistic course design, which has and will involve studying course teams’ use of visual representations during the design process over a period of 9 months.  Examples from our evidence base are shown as speech bubbles.

4       In use

Examples illustrating how CompendiumLD can be used within the design process are provided by  snapshot 1 and snapshot 2. Snapshot 1 illustrates an early stage of the  the design process, snapshot 2 a later stage when a more detailed description has been generated and some of the issues that arose in snapshot 1 have been resolved.

5       Conclusions and future work

The qualitative data we have gathered so far indicates that generating a visual representation helps to clarify designers’ intentions, and aids communication of those intentions.  Continuation of the iterative improvement of the tools and methods we have developed is planned for 2009-10, including trials across a range of UK universities. So far our work has focused on the representation of learning activities within a course or module. We will be looking at applying visual representations at different levels, e.g. across degree programmes, and requirements gathering workshops to inform this are planned for later in 2009.

References and further information

Full references for the citations in this poster are available from are available from http://www.open.ac.uk/blogs/brasherblog. Information about CompendiumLD is available from http://compendiumld.open.ac.uk.

Beetham, H. (2007). An approach to learning activity design. In H. Beetham & R. Sharpe (Eds.), Rethinking pedagogy for a digital age: designing and delivering  e-learning (pp. 26-40). Oxford: Routledge.

Conole, G., Brasher, A., Cross, S., Weller, M., Clark, P., & White, J. (2008). Visualising learning design to foster and support good practice and creativity. Educational Media International.

Cross, S., Conole, G., Clark, P., Brasher, A., & Weller, M.   . (2008). Mapping a landscape of Learning Design: Identifying key trends in current practice at the Open University. Paper presented at the LAMS Conference.

Nixon, S. (2007). LD project final report – final report of the LD VLE programme work. Milton Keynes: The Open University.

Okada, A., Buckingham Shum, S., & Sherborne, T. (2008). Knowledge Cartography: Software Tools and Mapping Techniques: Springer.

Wilson, P. (2007). Progress report on capturing eLearning case studies (Internal report). Milton Keynes: The Open University.

Permalink Add your comment
Share post
Design Museum

Deep thoughts on e-portfolios, the meaning of life, minds, like-minds and Avatar, via Nottingham university and GCSE hydrology.

Visible to anyone in the world
Edited by Jonathan Vernon, Thursday, 21 Nov 2013, 10:58

Does your e-portfolio get in the way or support what you do?

Whoever you are?

Whoever has a stake in it.

Thinking out loud, started on 12th October 2010, picked up again and rolled around my mind on 13th January 2011.

Wherein lies the beauty of a blog, or in this case an ECA that requires reflection on the mind games of the past four months.

There’s a picture in the New Scientist of how ants, in their hunger for a sweet that has been dropped in the gutter have gathered in, or moved away some forty or more leaves which now form a circle around the fallen sweet.

This is what I am doing as I reflect on the activities of H808, each e-tivity, each note, paper, report, forum entry, blog or e-portfolio asset is a leaf that until now has been scattered somewhere, online, offline, some in a heap, some laid out, some yet to blow down from a tree.

My mind, its little and large pathways, the synapses that run between the left and the right hemispheres, are busy with a thousand ants moving these leaves aside, while gathering some of them up to make a pattern.

From Essay Style Visualised

And then, for a moment I saw that six petalled flower I have drawn before, the shape of the A’ Level essay, but somehow I see also a podcast and the analogy fails and without even the politeness of animated transformation my flower becomes a Christmas Tree.

From Essay Style Visualised

On this tree, the structure of the ECA, I will hand 10 or more ‘things.’ No good my just thinking about it though.

Time to move on.

I recommend the use of eportfolios, whether or not they are packaged as such. Often the affordances are there anyway. I’d like digital building blogs as simple and as versatile as Lego bricks so that I could have a button away, on my homepage, depositories and repositories, that do the jobs of blogs, wikis and eportfolios without any need to feel they are separate entities, rather the words I think, and images I take or draw, or recordings I make are like a rain shower (with the occasional deluge or drought) that is taken care by the system, MySystem.

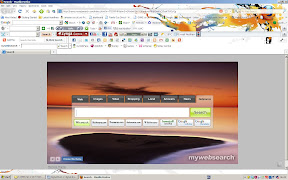
Is this a homepage? All those toolbars? Mine's a mess. I dream of a computer screen A1 size, two of them preferably and a homepage as busy as a photomosaic coverpop.

Currently it looks like this. Could someone offer some advice on how to get my head around this before my entire home page is a Venetian Blind of unwanted toolbars and browsers?

From Drop Box

MySystem would be an assemblage of tools and services to store, collate, elaborate upon, develop, select and share all that can be digitised. Text for the most part, but images too, still and moving. And numbers, as stats or formulae. Assets in polite society, 'stuff’; for a Saxon word and something in Latin for anyone trying to pull rank.

Whatever definition we come up with for ‘e-portfolios’, someone else has another one.

And why not, this is but functional flotsam-and-jetsam on the Digital Ocean?

My first blog in September 1999 covered this. Perhaps I should shift my thinking and take in ideas of both oceans and clouds, the binary code the water molecules the form the water cycle? Now there’s an idea: the Internet as something fluid, changing, responsive ... predictable to a degree ... its shifting patterns advancing relentlessly rather than recycling, the apocryphal butterfly in one part of the system beating its wings and having a profound effect elsewhere, the Twitter-effect. This analogy of oceans and clouds hasn’t changed in a decade, perhaps it is the Geographer in me?


From Drop Box


I am still looking at a year 8 geography exercise book featuring the water cycle.

‘Analogies taught man to think.’

Now who said this?

I have it on a sheet of motivational quotes given out at the School of Communication Arts by John Gillard. This sheet and some other papers, a portfolio of ideas, is in a portfolio (the physical kind). There’s a storyboard for a couple of commercials: I could shoot these on my phone. Indeed, given that one takes place up a cliff face the phone might be the best camera for the job. No amount of Googling has located it for me. Proust perhaps? Shakespeare … or a commentator on Shakespeare?

All e-portfolios are squirts of ink into this ocean.

All content is drips, drops and an occasional multi-coloured deluge. Though pre-empting bespoke consultative decision making on behalf of a client, real or imaginary, my simple advice regarding e-portfolios is - do it all.

1) Your own - that does the business and ought to be the final repository for e-materials that are being shared or assessed, that is easy-peasy to link or upload for those who are expert in these things or have a system that they play well and with which they can 'sing.'

2) A smorgasbord of off the shelf e-portfolios that people may get free, or as part of their trade or other association, or be happy to subscribe for (after all, there's a good deal that can be done with them that is personal, off-campus and away from work).

3) Their own. The end result, the content and where and how it is finally presented is all that matters. In any case, there is every chance that your students are more e-literate than you are, speak the code like their Mother Tongue and will do what so many students have done before them and re-invent the digital wheel. The content is its own subject matter expert – it is out there being freely exchanged and wikified to the ‘nth’ degree of finality.

4) With institutional, administrative, management and support from academics and tutors that also encourages peer support and so enables 1, 2 & 3.

Everyone will have their own idea of what an e-portfolio is … if it ‘is’ anything at all in the physical sense, because of course it isn’t until you print it off, or play the asset. It isn’t a trunk, it isn’t a filing system.

Perhaps in truth it would look as bland as the grey matter of your brain?

Why and how does this help anyone?

By visualising something you give it powers.

The problem lies where your visualisation doesn’t match with mine, but as the designer it is my world that you have to live within in. I suppose we each of us require a bespoke website and a team of people working on it to forge this link between what enters and leaves our heads.

So why do I hear the voice of Dr Angela Smallwood?

It was the JISC conference at the Queen Elizabeth II Conference Hall of Parliament Square.

It was a workshop on e-portfolios. ‘I was a baby’ (quoting Neytiri from Avatar talking to Jake).

But I bought into the idea of ‘deeper thinking’ and how it is achieved. Wasn’t the computer in Hitch-Hiker’s Guide to the Galaxy called ‘Deep Thought’ ?

Food for thought?

Breakfast.

Bacon, toast and a fried-egg.

Only blog for the day, I promise.

Work to do!


Permalink Add your comment
Share post
Design Museum

More visualization ... fewer words, greater comprehension!

Visible to anyone in the world

Creators of course content need to put thought into visualising information in simple, single page graphics that are easy to grasp.

“While such diagrams are useful to convey an impression of complex software systems, anyone who has tried to delineate the boundaries between such systems will know that boxes and arrows greatly simply a messy reality.’’ Weller (2007:4)

Well thought out expressions of data, facts and stats, as well as concepts, can not only be enlightening, but memorable. David McCandless is a recognised exponent of the art of making information beautiful. McCandless, 2009

Being here suggests that I am a words person, I call myself a ‘visualiser’ though I admit to giving up on writing HTML even with the likes of Dreamweaver some eight years ago. Get someone else to do it! Too much faff. Attended London’s School of Art, copywriting, art direction and design. Had the option to follow a Fine Art MA rather than turning up here. Might I have produced a few memorable canvases by now had I taken t hat route?

REFERENCE

McCandless, D. ( 2009) Information is Beautiful.

Weller, M. (2007) Virtual Learning Environments. Using, choosing and developing your VLE

Permalink
Share post

This blog might contain posts that are only visible to logged-in users, or where only logged-in users can comment. If you have an account on the system, please log in for full access.

Total visits to this blog: 11292887