Professor Bart Rienties of the Institute of Educational Technology at The Open University
January 2018 > https://youtu.be/GIWrygqmOIs
Creative Commons Attribution licence (reuse allowed)
45 minutes? This is how long 'Take Your Teaching Online' gives to undertake the activity. It is far, far too little time to do justice to it.
That's 35 minutes viewing to begin with add taking notes and 10 minutes to construct a reply. I gave it two hours.
This is worth this amount of effort and more; I will be going back to it.
There are two reasons why is essential viewing for anyone venturing into teachign online:
1) This is an excellent lesson in how to deliver a lecture
- The pace, variety, personal story telling, top and tailing (literally) with dogs and then heavy duty data expressed in tables and charts. All the while having the audience to feed in with a poll.
2) The conclusions that Prof. Bart Rienties draws are profound
- Just in the period since the OU changed its fee structure (much more expensive) what students look for has shifted increasingly towards the relevance of the materials and qualifications to their job
The data blows away past perceptions and methods while reinforcing what had been an indicator of excellence vs failure all along.
- Student satisfaction surveys bear no relation at all to peformance.
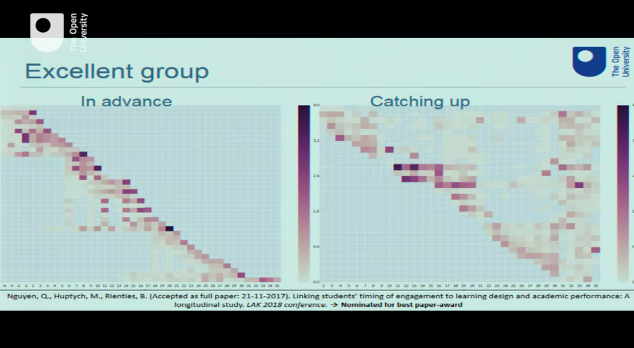
- Giving students nothing to do can result in the most activity - it becomes at chance for those 60% of more who are a little behind, or a long way behind, to catch up.
- Those who are always leaving it to the last minute and think that they can catch up in a last minute splurge of activity are likely to be those who just pass or fail.
The best approach all along, and an indicator of excellence, is to get ahead of the curve.
Not least it gives you breathing space to go back to something when you've had time to think about it, or to hunt down and check through alternative insights. As well as engaging on the subject if you wish outside the class.


I ask myself, 'these are adults, they are academics, they are Profs and PHDs, and yet some use their phones to give quiz answers answer before they've been given the question. What does this say about us humans? Is it the gambler's gambit?'
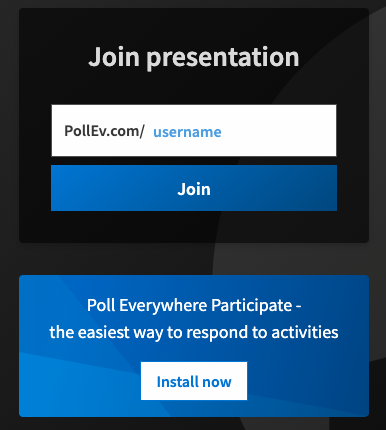
Prof. Bart Rienties was using PollEV.com
Bart gets our immediate attention with a puppy. We are introduced to Tabatha from Canine Partners > https://caninepartners.org.uk/
By way of engaging metaphors data is first provided on three assistant dogs
and then from the speakers competitive cycling.
These metaphors are used to indicate different kinds of data, the kind that is useful, and the kind that is not. And the need to be measuring something in the first place
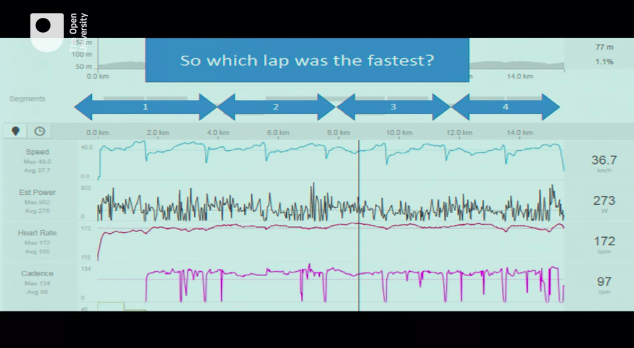
The truth will out with the data
QQ: Can we use this data to give students what they want?
Ask them at the end of every module.
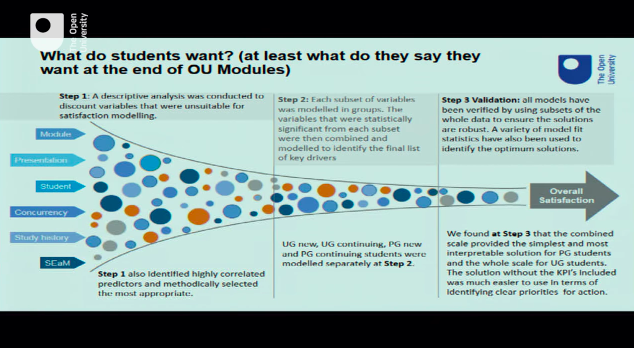
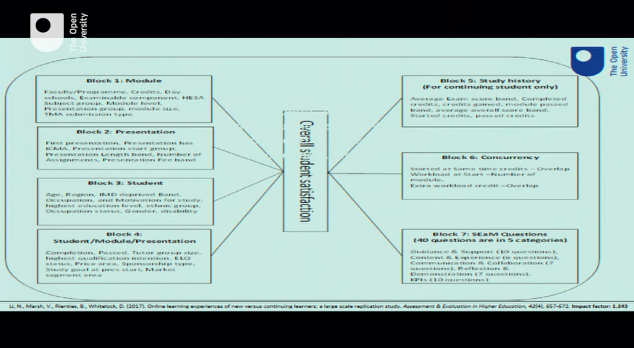
Big data set
- 110,000 students
- 400 courses
QQ: What makes the course 'good' ? (As in getting results) is it:
Great reachers?
Links well to professional practice?
Links well to their career intentions?
Quality of the teaching materials?
Quality of the teaching?
This is what 40 people from the audience concluded. (40 was the limit of the licence bought from PollEV).
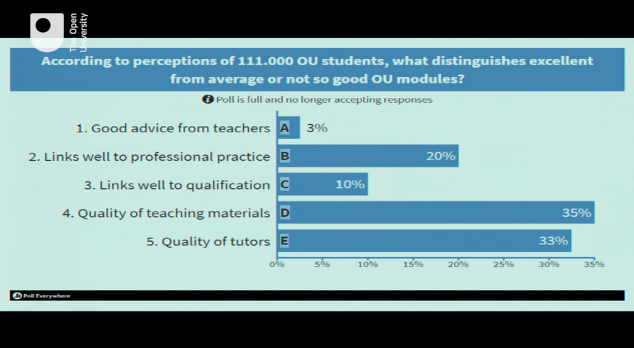
Here is the detail:
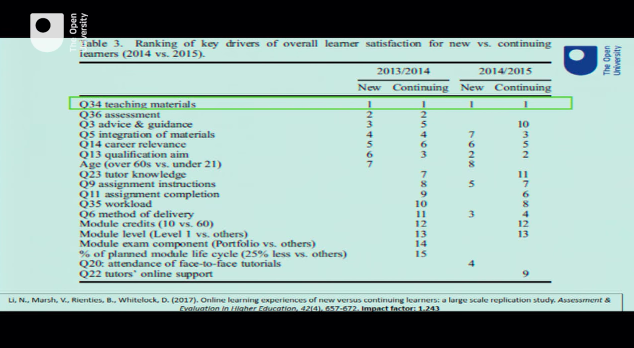
What makes an excellent course?
There has been a subtle change over the last few years

NOTE >
There was NO correlation between student satisfaction and student performance
Students like constructivist learning designs
This is where there is lots of stuff, we take them by the hand … providing lots of content for them to explore.
They did not like when they had to work together with a group, or talk to the teacher.
The number predictors of passing and continuing is how teachers design the learning and how they communicate during the course.
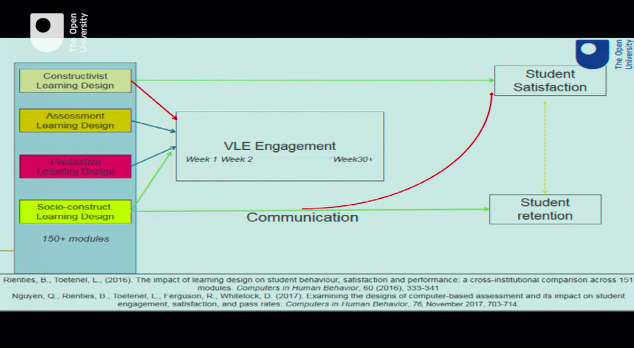
Starting to unpack the recipe what helps our students progress so using the social constructivist model.
What are students doing on a week by week basis.
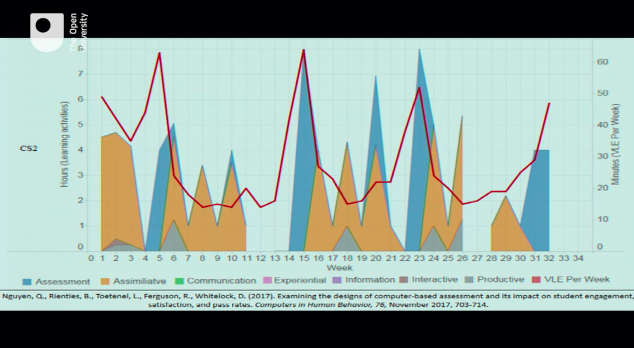
Is there a link between how teachers design and how students engage?
Unpack what is really happening?
Why despite expectations of a lot of student engagement in week 20 was there not?
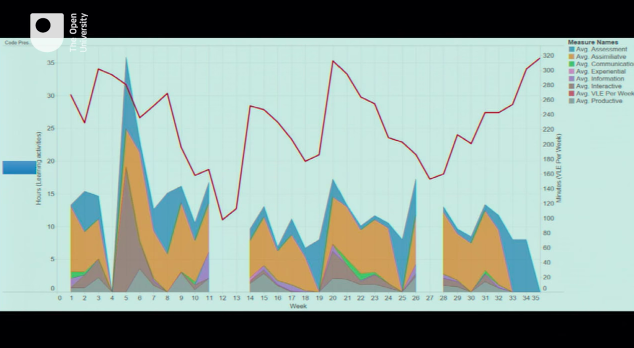
Start to map out what students are doing.
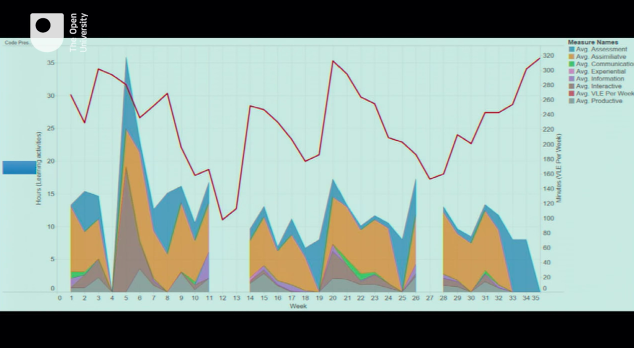
Week 4 time off to prepare … and becomes one of the highest peaks.
69% of what students do is determined by what teachers have designed for them to do.
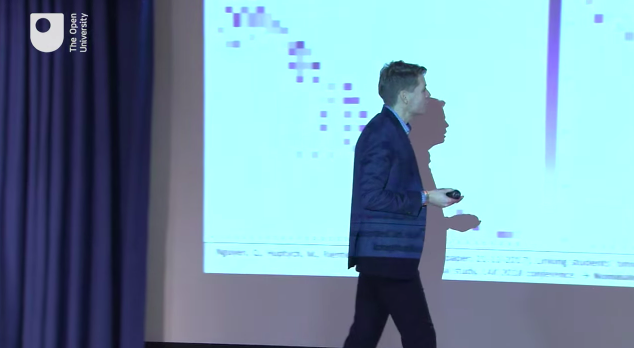
Excellent students study more in advance.
Pass students start to get in the ‘catch up’ phase > they are going ‘off piste
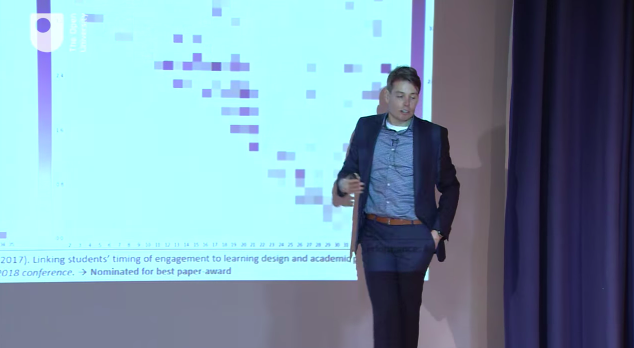
Fail group > starting to catch up, or never catch up. So how do we give them a chance? A pause to catch up.
What are our take home messages?
Not all data we collect is meaningful.
What matters is actual behaviour. Big data without context is meaningless.
NOTE > Listening to student feedback is not linked to what they are doing or how they are performing.
Our students are following the learning design, but many are not. Some diligently stick to the road, others take different routes.
NOTE > We need to provide alternative effective pathways.
End with Canine partners and foster parents.
Organ donation
