Please be more specific!
My refresh button thumb is getting sore!
I don't imagine I have actually failed H817 but I am itching to change my Facebook name to Anna Greathead PG Dip (ODE) (Open).
Please be more specific!
My refresh button thumb is getting sore!
I don't imagine I have actually failed H817 but I am itching to change my Facebook name to Anna Greathead PG Dip (ODE) (Open).
H818 feels quite different to either H800 or H817.
Both of my previous modules felt solidly academic even though the delivery, assessment and teaching was done differently. I basically knew that I had to do the activities, do some extra reading, write an assignment which answered the question and was internally logical and then I would succeed.
H818 feels, already, like it might present of a challenge. There is a very strong push to produce something to 'publish' rather than a piece of work which will demonstrate to your tutor that you have understood the course and grasped the relevant concepts.
The word 'networked' obviously provides a clue but the extent to which we are to be working as a group n H818 scares me a bit! Group work in H817 was difficult!
Plus I am having to get to grips with yet more OU resources which don't quite match proprietary equivalents in terms of usability, intuitiveness or appearance.
Argh.
I completed my EMA about social learning analytics with full weeks to spare. (2 of them to be precise!). It came together gratifyingly nicely and I enjoyed it. Of course it's possible that my tutor will disagree and give me a dreadful mark (not due until December!).
But I had mere weeks off from studies and have now begun H818 - The Networked Practitioner. I want to get MAODE done and dusted by the end of 2020 so can't afford to rest on my laurels!
Watch this space for my H818 adventures!
What will all of this mean for me?
Human nature is essentially self-centred. Any new project, innovation, change or progress will be assessed by individuals by how it will affect them. However successful learning analytics promises to be in terms of creating better environments and activities to foster better learning - the individuals who will need to change their practices to accommodate change will, at least initially, think about what will change for them. Educators may have concerns about increased workload, they may have concerns about their own ability to manage the newly complex world of blended learning and fear that their inability to grasp and engage with it may have consequences for their own careers, they may not really understand what is being asked of them or why change is being implemented which will compromise their engagement.
Why are we doing this?
Changes in LMS or VLE in any institution is likely to be made at a high level but working out the nuts and bolts of the new technology and process falls to the educators at the 'coal face'. The coal face workers may have less understanding of the 'big picture' or long term aims and objectives but will have to make significant, time consuming and difficult changes to their own daily practice, Without a good understanding of the strategic aims it is hard to enthusiastically participate in the strategy.
Our ancient traditions must endure!
Universities have a 'model' which has endured for many centuries in some cases (and even in new universities the 'model' is often older than the institution). The accepted model determines the selection of students, the learning activities, the curriculum, the assessment methods. Any effort to radically change any part of the model meets resistance. University leaders are expected to inspire but not actually make any changes!
This paper attempts to consider 'learning analytics' from a variety of academic perspectives rather than concentrating solely on education.
The aim of the authors was to identify trends and also assess the most influential voices within the field of learning analytics. As well as individual voices the authors also noted that multiple disciplines were writing about learning analytics and that the relative contribution to the overall conversation between different disciplines was not equal in quantity or influence. Their method was to analyse citations and map their use in a structured network. The assumption was the papers most regularly cited, and by the widest range of contributors, could be considered as being more significant and more likely to be moving the discipline forward.
The observation was that the discipline of education – with its easy access to vast quantities of data – was not being as innovative in using that data as one might expect. Education was using simple demographic data alongside easy checkpoints such as student retention and outcomes. The suggestion was made that the data being collected could be used to contribute to better learning and teaching but, at the time of writing, it was not being used that way.
Education may seem the obvious discipline which will both discuss and utilise learning analytics the paper makes clear that other disciplines are also taking the discipline forward including psychology, philosophy, sociology, linguistics, learning sciences, statistics, machine learning/artificial intelligence and computer science.
The authors found that the major disciplines – computer science and education – were diverging and that learning analytics was thus going in more than one direction.
They also found that the most commonly cited papers were not empirical research but more conceptual in nature.
The use of ‘low hanging fruit’ (readily available data) is also discussed with hope that better and more useful learning analytics will develop.
The use of citation networks enables the authors to see where concentrations of papers are being published and how they link to one another. They can assess where ‘crossover’ papers develop which feed into the discussion in more than one academic discipline.
It would be easy to assume that the most regularly cited papers are the most insightful, methodologically consistent and ground-breaking. This would be, I think, an over simplification. Certain journals are more widely read within certain disciplines and the specific place a paper is published will determine, to a great extent, its audience.
I can see the value in this kind of analysis. Where many different researchers from different academic backgrounds are all looking at the same subject – albeit from different angles and with different motives – the potential for a ‘big picture’ (and overarching theory) to emerge is an engaging prospect. I also can see how the varied angles and motives can enable each different discipline to consider new ideas and take their own understanding of, and use of, learning analytics forward.
The opening paragraph of this paper
by Dawson et al. neatly summarises a major weakness with learning
analytics - that the data gathered is gathered incidentally rather than
with pedagogical intent.
The obvious question to ask is 'what data would be more useful?' and then 'how can we collect that data?'
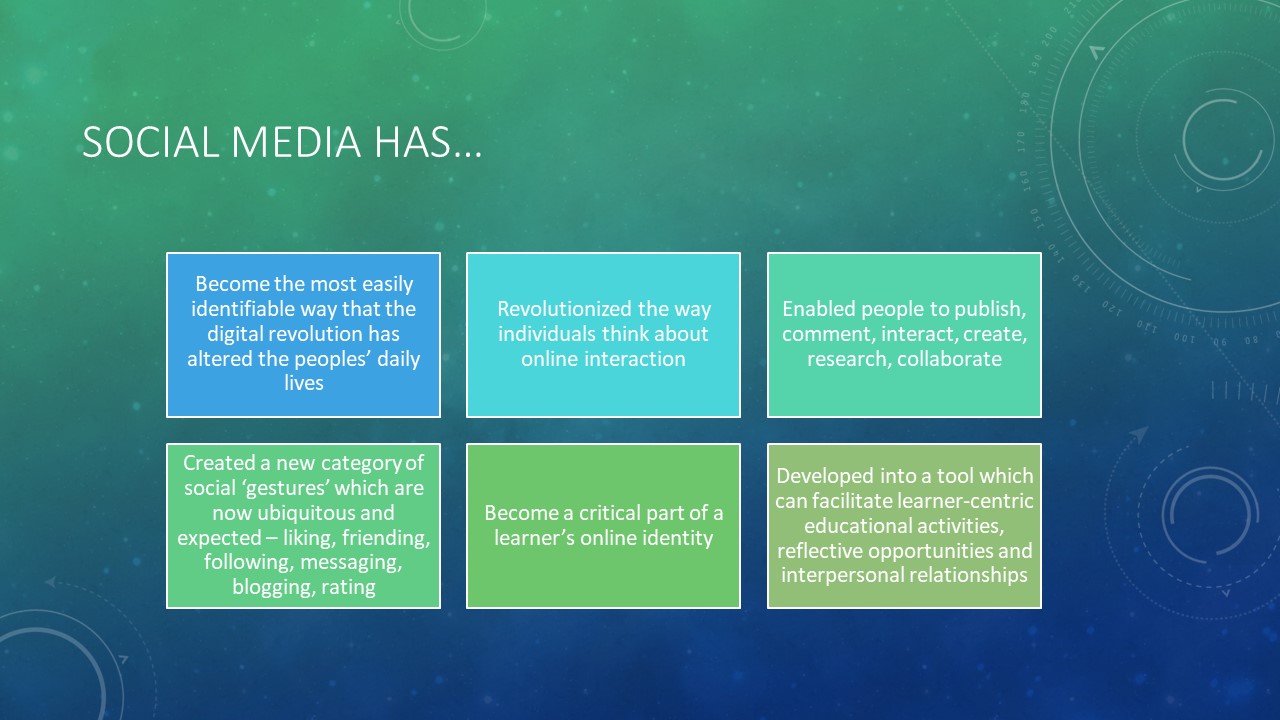
Social
Learning Analytics is based on the premise that the answer to the first
question is 'information about the interactions between learners' based
on the observation that knowledge is increasingly distributed and
learning has become less about learning knowledge from a 'wise sage' and
more about connections and collectively held knowledge.
The
second question - how can we collect that data? - presents a problem.
It is not difficult to track forum contributions or similar within an
institutions VLE. The interactions can be automatically tracked and the
length, time of and words within those posts can be classified and
codified but the assessing the quality of engagement requires human
input. This is merely the first issue: most interactions between
students don't happen within the VLE. However slick an institutions VLE
is it is unlikely to be as intuitive, familiar and easy as platforms
like Facebook and WhatsApp. Students will opt for easy for them over
helpful for the institution.
The idea of any institution monitoring and analysing my Facebook and WhatsApp conversations is creepy!

I got stuck this weekend.
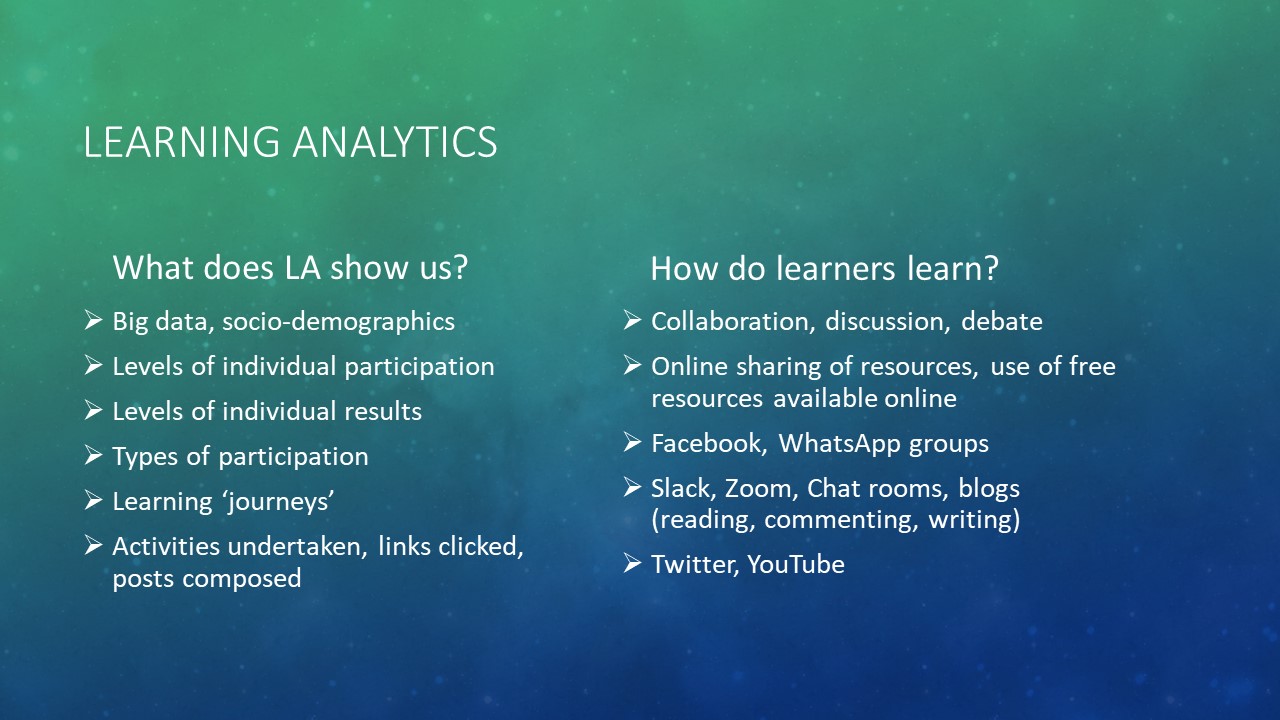
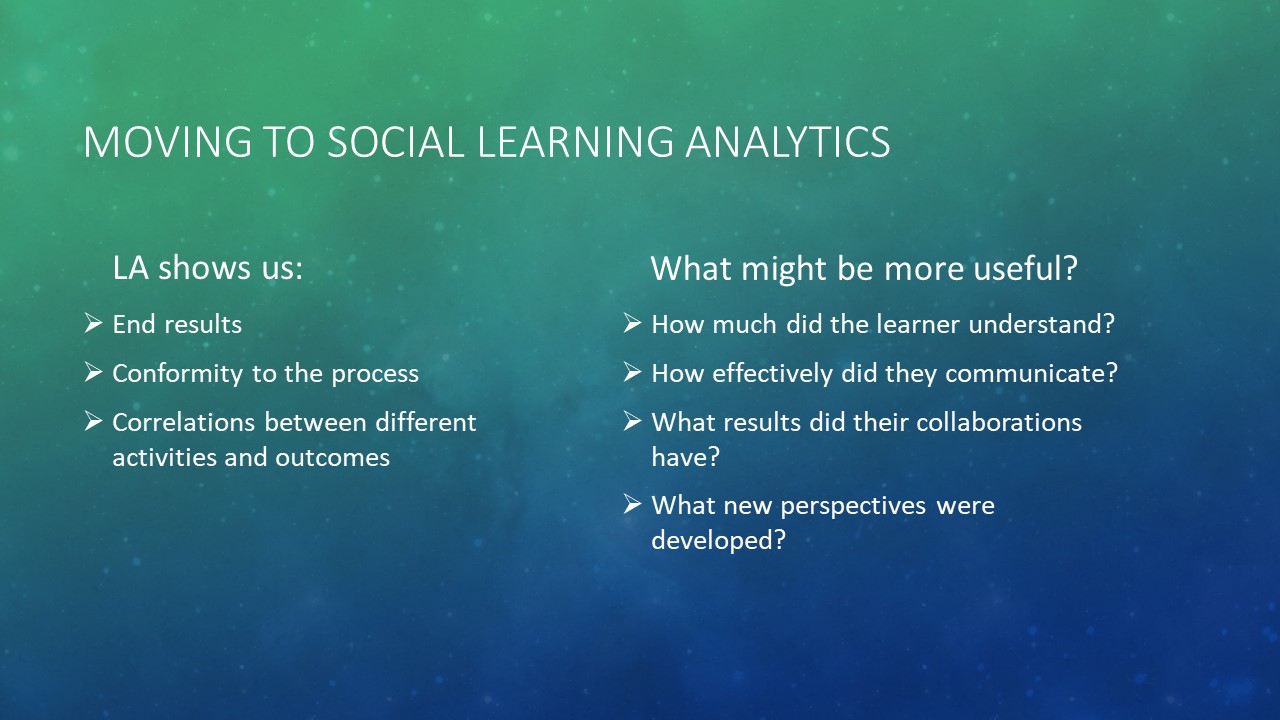
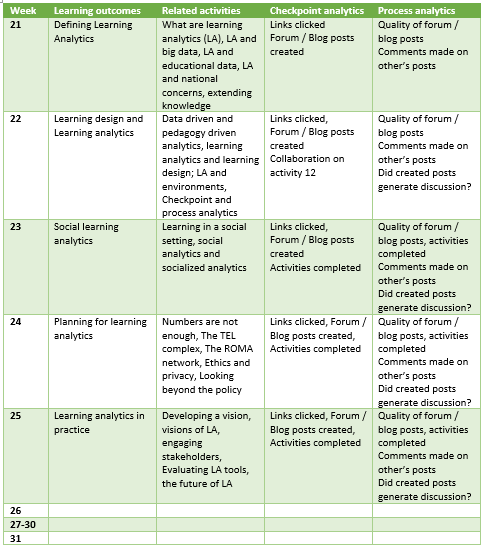
I grasped the concept that Lockyer et al. were communication. The checkpoint vs process comparison is simple but beautifully so. A major criticism of learning analytics, as we have studied to date, is that it necessarily uses the available data (which has not been collected with pedagogical advances in mind) rather than data being collected specifically with analytics in mind, Checkpoint data is the main data we have and shows us the easy to measure metrics - who clicked on the link? When and where? On what device? How long were they logged in to the VLE? How often did they post in the forum? When did they submit their assignment? How good was their assignment? How does any of this correlate with the socio-demographic data we hold about them?
The process data is more difficult to measure being more nuanced and essentially qualitative. Questions which might generate process data could include:
There have been a number of activities I have got stuck on this week. The material is interesting and accessible but the questions we are supposed to consider as we reflect on it are not!
The activity about the paper by Dyckhoff et al. was really interesting and especially got me ruminating on how learning analytics makes use of data which is incidentally collected - the key word being incidental. The data sets created in learning (and everywhere) are huge and contain a lot of detail about various aspects of life but the data is not collected to be analysed. The analysis happens due to the availability of data, the data is not collected for the purposes of analysis. The prospect is that 'easy' research is done using available data to drive pedagogical change rather than pedagogically useful data being collected in order to drive pedagogy.
This is not to say that learning analytics based on big data are not useful. They might not answer the exact questions which learners, educators and institutions would choose to ask, but they do answer questions. As with any big data set - extracting the useful data from the background noise requires finesse and insight.
This blog about library usage is rich with data driven analysis. Libraries generate data by monitoring access (typically by swipe card, PIN code, login), engagement and activity. Modern libraries - often buildings which could house nothing but internet access to digital books and journals - generate even more specific data. Libraries do still have collections of physical books and journals but as archives are digitalised and new material exclusively published digitally - these will eventually start to shrink. People seem to have an emotional attachment to 'books' (try any conversation comparing a Kindle e-reader to a 'real book' to see!) but researchers are hopefully more pragmatic and appreciate the convenience of not only being able to search for literally millions of publications in seconds but also to search within them for particular chapters, references and sentences. This access to more and more information must impact on the pedagogy of those who teach learners who use libraries. The blog makes the point that data can show correlations but not necessary causation. However - correlation may be enough to provide interventions when a student may be struggling, or redesign when a learning activity fails to inspire engagement.
The final article by Lockyer et al. describes the difference between checkpoint and process analytics. I like these distinctions. There are echoes of summative and formative assessments within it and I feel confident I can grasp their meaning! Within my OU journey the institution can easily assess me using checkpoint analytics - they can see details of my socio-demographic status, they know when, where and for how long I log into the VLE, they know how often I post in the forums (and in my blog), they know what I search for in the library and they know my assignment scores. What they don't know (because the data cannot be automatically mined) is the quality of my forum and blog posts, the level at which I engage with activities and assignments, how many of the library resources which I click on are actually read in any meaningful sense. My tutor may be able to make a valid guess at these factors. The area in which process activities could generate data would be in evidence of inter-student collaboration and communication but as our group work (and study-buddy friendships) operate outside of the VLE, there is not way for the OU to be able to monitor them. (If they did there could be privacy concerns as well).
I know that we use Google Analytics at work but not for Elearning. I have never been involved in the discussions about Google Analytics nor have I seen the data. However - as a data junkie I now carry a strong urge to demand access to all the data sets because I can see how interesting this could be.
With regard to applying
Google Analytics to learning I am initially struck by how this model is
clearly designed with commercial applications in mind. The services
which might be of benefit to a learner or an educator are only useful
insomuch as they may enable better, more targeted and more appropriate,
learning opportunities to be developed.
Google
Analytics is, I believe, a commercial enterprise. As with all such
enterprises - the principle aim is profit and other gains are
incidental. Gains associated with learning are, therefore, mainly for
the aspect of learning which is most associated with profit - the
institution.
However - this data *could* be used to help the learner and the educator, The issues with using it that was are not only due to a profit motive of a private company but the way that big data may have to become much more specific to be useful in individual circumstances. I would, for example, be very interested to see how well I am doing in H817 compared to other students on the course, compared to students in previous cohorts. I'd be fascinated to know what expectations the OU may have had for me based on my simple socio-demographic information. I would like to see where I rank in terms of engagement with the material and I would be interested to learn of any aspects of H817 I had simply failed to grasp properly. I would love it if the curriculum I followed in H817 would shift and sway according to my interests, the pace I was most comfortable with and even my personal schedule. If I were to know all of this though it may be at the expense of the privacy of other students, it may be at the expense of the integrity of the course and it may be at the expense of my own work ethic!
This paper from Rebecca Ferguson gives a concise and ordered review of a burgeoning and almost chaotic subject development! It's ironic that something which sounds as definitive as 'learning analytics' can contain so much nuance and so many different opinions. It seems that the term came into use in several contexts simultaneously and was used differently each time.
I feel that the three bullet points on page 9 crystallise the current issues best:
Learning analytics is clearly a term which is used to describe a particular phenomena which can happen on a wide range of scales.
Personally I am interested in how my individual socio-demographic circumstances can predict my success (or otherwise) in any aspect of learning and how interventions can be targeted to assist me. I am not entirely selfish - I am also interested in how this can be applied to other people!
Professionally part of my role is to tutor aspiring medics and dentists for the UCAT exam (formerly UKCAT) which is an aptitude test which must be taken as part of an application to most medical / dental schools. Upon registration the UCAT consortium ask each applicant to complete a series of socio-demographic questions - racial group, gender, level of education reached by parents (the vast majority of applicants are 17 years old) and the job title of their parents (presumably used, alongside education, as a proxy for social class). They already have the applicants post code and know if the applicant lives in a household with low enough income to qualify for a bursary. This information is not supplied to universities but is reportedly used to improve the UCAT for future cohorts. Pilot questions are trialed with a view to ensuring they are as equitable as possible. I imagine that groups of statisticians gather around data sets and assess why various questions performed better with people who had parents with higher educational qualifications, or who shared a similar ethnic group. (Incidentally - I teacher friend of mine got very frustrated one year when the disadvantaged children who attended her inner city primary school were faced with SATS questions about going to the theatre, and using a honey dipper - two activities which were entirely unknown to most of the children she taught. A huge failing in learning analytics or a cynical attempt to maintain existing privilege? Who knows!)
The articles we read in this activity looked at early learning analytics on a national scale. I also find this very interesting. The variation between educational styles and ethos between different countries is driven by many factors including culture, politics, and resources and comparisons can be meaningful and meaningless depending on how well the complexities of the issues are understood.
The first paper compares the USA to other countries - noting not only a lack of progress when compared to nations of similar levels of development and wealth - but also an up and coming threat from developing nations with very large populations.
The second paper introduces the idea of using analytics to shape future US educational policy at the national level with a coherent and unified plan. Affordability and value are key values but a need to match education to likely economic requirements is also significant.
The basic premise of these discussions assumes that there is a direct correlation between graduate level education and national prosperity. There is, at least in these papers in this time, little discussion about what is being studied and to what end - merely that high levels of education are necessary for continued improvement.
As is pointed out - both papers were written before 'learning analytics' was a phrase and though they clearly are referring to a similar process the absence of 'big data' on quite the scale as it is available today means that it's not exactly the same thing being discussed. However - the idea of analytics is clearly here with a vision to use data to improve polcy.
Costa Coffee is my favourite of the high street chains and I buy coffee from there about once a week on average. This article announces the companies intention to use 'big data'. The article is short of specific details but gives a few broad motivations behind the initiative. These are:
As if often the case in Wikipedia, the article on Learning Analytics began as a quick summary and rapidly mushroomed into a far more extensive treatise on the subject. However - the initial definition has had few versions. It changed in the first day, then again a couple of years later, but the sentence written in 2013 is the same as the sentence which opens the article today. The difference is that in today's article this opening sentence is followed by over 4000 words of further information.
Learning analytics is the use of data and models to predict student progress and performance, and the ability to act on that information - 23rd August 2010
Learning analytics is the use of intelligent data, learner-produced data, and analysis models to discover information and social connections, and to predict and advise on learning. - 24th August 2010
Learning analytics is the measurement, collection, analysis and reporting of data about learners and their contexts, for purposes of understanding and optimising learning and the environments in which it occurs. - 1st September 2013
I usually like to begin my investigations about an unfamiliar subject with a read of the associated Wikipedia article. I realize that it's not a peer reviewed, 'reliable' source but it is often succinct, accessible (especially to to the non-expert) and well written with good clarity. The learning analytics article is none of these things and it reads as an article written by committee (which is, of course, exactly what it is!).
The impression that the whole article gives me is that the subject of 'Learning Analytics' is as vast, as nebulous, as complex and as multifaceted as the two words would imply. H800 challenged every internal impression and idea I had about the concept of 'learning' so I am keenly aware of how 'simple' ideas can become mosaic when investigated and the word 'analytics' gives us no expectation of a simple and easily defined concept! Put two big concepts together and the creation of a gargantuan concept seems also inevitable!
The simple sentences above describe aspects of learning analytics. My impression is not that those who change the definition claim what is stated is incorrect, but that it's incomplete and inadequate. The extra information, text, ideas and paragraphs don't detract from what has been previously written as much as adding to, augmenting and complementing it. There are a multitude of associated concepts which overlap with Learning Analytics but the edges of each concept is blurry and undefined.
I suspect a concise definition which will satisfy everyone is impossible to develop but by looking at the areas everyone agrees with we can draw some conclusions. Such commonalities include:
TMA03 - the group work assignment - is done. It's been a blast and a trial.
I am truly impressed by what we have devised and created. If it were a real product I would have high hopes for it being successful.
But the last week has felt somewhat anti-climactic. We (sensibly) got everything we needed to do finished by the end of last week and left this week for us to write our individual reflections.
And it's felt oddly chilled!
I didn't feel too stressed. I wasn't rewriting sentences and paragraphs until the early hours of the morning. I submitted it - unsure that it was exactly what was required - without fanfare, relief or panic!
Anyway - onwards to block 4.
A heuristic evaluation is a usability inspection method for computer software that helps to identify usability problems in the user interface (UI) design. It specifically involves evaluators examining the interface and judging its compliance with recognized usability principles (the "heuristics"). Wikipedia
I've honestly never heard the word heuristic before (and I know a lot of words!)
Once more I am up against an OU activity task which I barely understand and feel utterly ill equipped to complete.
Our group project has done what many projects seem to do - rapidly mushroomed from being something theoretical and distant into being a fully fledged and almost complete project. After weeks of discussions and foundation work the actual thing feels like it has suddenly appeared. And now I am supposed to go and use it and find everything I can which is wrong with it!
There are a number of problems with this!
1. My personality means that I neither like to receive or give anything which can be perceived as criticism! Rob, my team mate, has done a phenomenal job and the tool created is looking really good. Are there things I would change if I had both full creative control and vastly improved technical skill - of course. Is there a single thing that I think is sufficiently bad that I want to create extra work and further debate - NO!
2. The 'heuristic' templates are complicated! I am unsure - even having read them all a few times - whether we are looking for broken links, unclear instructions, design features we don't much like, things we wish were there but aren't, things we wish weren't there but are.... it seems we have to connect every little quibble with some theory. This is making the whole task seem impossible.
3. Time is short. We need to get this done so only small things can realistically be changed. But I don't know what is small and what isn't because I have not got the faintest idea how this tool was built! It is not an exaggeration to say my heart leapt when it became obvious that Rob was a Moodle expert. (Cut me some slack though - I made the original template of the website!)
4. The site looks good. Any issues I have with it don't seem to fit the dominant heuristic model about usability. (Again - what exactly does it mean?!)
Anyway - I shall try to work it out.... again! And I also want to get a bit more done on my personal reflections about this project. I keep reminding myself that this accounts for 72% of the overall grade! ha
An academic setting, with its fake contexts and imagined personas, can ask that a learning program be designed, or a learning tool be developed, in a specific order and way. In real life the the learning program must be fitted to an actual context with real people and programs are developed according to the capabilities of the available technology rather than developing technology to fit the ideal scenario.
I have experienced some frustration in this TMA03 process due to the very deliberate and linear way the activities have been set. Finding and describing the theoretical underpinnings of anything at all is something which hardly ever happens and when it does it is usually done retrospectively rather than at the start. While I understand that fitting the theory to the activity may seem backward it is the way most people operate most of the time.
I don't think this is usually a bad thing. Theory describes why and how things work but often our experiences and intuition enable us to make valid choices - which fit with theory - without us having to refer to theory beforehand.
I remember being so grateful when someone who knows this stuff (a psychology graduate and trained counselor) told me about Imposter Syndrome! I thought I was the only one!
Anyway - that's been the story this week. I made a case study spreadsheet which has, apparently, been very helpful. I got it done reasonably early in the week which was good as I have been ill for a few days and unable to do a lot more. It was also helpful because my work was a foundation for other tasks which needed to be done and I was off the hook for them!
But it couldn't last forever. We had another web conference in the week about which I remember little. I was taking codeine and whilst it all made sense at the time I don't really understand the next steps!
Nevertheless I had a go this afternoon at two activities. I have produced *something* for each of them but I am extremely cautious about them both and think (as ever) that it will all be wrong and I'll be found out as someone who simply does not have what it takes for post graduate studies! I've been expecting to hear this from my tutor at every assignment point for over a year... somehow hearing it from a class mate would be worse! Less private for a start!
Group work is getting better. I've made my peace with the fact that we won't all be equally active or productive. And that includes it being ok for me to have a light week once or twice. Overall I know I have been a useful team member (at least if judged by participation and output) and I must be satisfied with that. I am seeing that what we are collectively producing is actually pretty decent. Six heads are better than one.... thought I might argue that three heads are better than six but that's another blog post!
It's funny how someone can say something to you which gives you immediate and significant insight into your own self in some way and enlighten you to something you had never noticed but was probably very obvious to everyone around you!
One such instance for me was my boss at work telling me I was very 'task focused'. By this she meant that I very much enjoyed having a fixed task to work through. At it's most basic level I can enjoy a bit of data inputting - seeing the lines add up on a spreadsheet gives me a very slight frisson on pleasure! A bit more fun is being asked to create or write 100 information cards about a range of medical issues. Being able to tick a few more off at the end of the day is very satisfying.
At work I create elaborate virtual (and real!) 'sticker charts' to track and reward my progress through a long project. I like to know that I am 18%, 23%, 48%, 79% or 92% if the way through! The problem is - in real life projects never really finish - or they don't finish at 100%. In real life you'll get to 92% and the project will be pulled, or put on the back burner for later, or taken forward without you having quite finished your bit. Or you get to 100% and find you've finished the fun bit but that the rest of the job is fiddly and frustrating and dull.
In the group project I have been waiting for something which fits into this mold to come along! I am able to do all sorts of tasks and competent in lots of things but a big project I could patiently munch away on is what I wanted!
So now I am analysing various case studies (found by me and my group mates) according to the STARR framework. The idea is to spot ways in which case studies are like, and unalike, our project and maybe spot some pitfalls we can avoid and some great ideas we can appropriate. I've created a colour coded spreadsheet and everything!
This will most definitely keep me busy tomorrow (Tuesday is usually my main study day) and maybe for a couple of evenings beyond that too! Fun fun fun!
I'm a week behind on activities (I think the whole group is and I think we are ahead of some of the other groups).
The first page of the fortnight which began a week ago used the words 'take stock' of what we had done so far.
Distributed group work has been challenging but also satisfying. I have been forced to learn and adopt new things but have also had the opportunity to show what I could do already. So here's my top ten of the project so far.
After the joy of my TMA result yesterday I did some mental maths to work out how close I was to 'passing' the first part of H817.
And in doing so learned I only needed to get 20% in TMA03 to pass the continuous assessment part - and if I manage that I don't even need to bother with TMA04!!!
And that got me thinking about TMA03. The group work and project is so hard on lots of levels and yet it still only counts for 28% of the grade. I can see some reason behind this. Group work is often 'unfair' with some people contributing much more than others and even where the amount of contribution is even the quality may be vastly unequal. We all get the same mark for the group work component unless someone fails to contribute at all or that their contribution was sufficiently low that the tutor awards them a lower mark. Awarding several people a mark which was only earned by one or two is an inherent risk. Therefore - making the essay component of the assignment worth 72% allows appropriate differentiation to take place.
But I have worried, and stressed, and tinkered and toiled on the group project and barely done anything on the personal part. I can see that the effort for both parts of the assignment will be almost exactly inverse to the proportion of the marks.
I was actually at a National Trust tea room when my WhatsApp started to buzz with the news of the TMA02 results being out. This could have gone either way - I could reward myself with a lovely cream tea if I did well, or I could console myself with a lovely cream tea if I didn't do well!
I couldn't get my feedback on my mobile phone but I could log in and get my score..... and I did well! So much better than I was expected - a full 20% higher than I was braced for. Celebratory cream tea it was!
I'd found TMA02 hard work - I had a good idea but I found it hard to demonstrate a good theoretical grounding for it and had struggled a LOT with the word count. I understand that the OU don't want to make their tutors mark 10,000 word essays but sometimes the word limit is so restrictive that keeping within in is only possible at the cost of good examples, ideas and quotes.
I got home and immediately got my feedback. In light of the word count issue I was someone bemused to find many suggestions for extra things I should have discussed or points I could have developed further! Absolutely no comments to indicate which bits were superfluous! OU marking protocols are clearly devoid of irony!
But either way it's been good. I calculated that I now have 17.64% of the 40% I need to pass H817 and 35.28% of the 40% I need to pass the OCAS. That is not a bad place to be in when I have only completed 21% of the overall work and 42% of the OCAS marks available.
We have chosen a context for our TMA03 group project - we are going to develop a technology based way for NQTs in secondary schools to keep a digital diary for reflection as they train.
In the end it was an easy decision - teaching is an area where reflection is already well established in professional training and practice and we all have some experience with teaching.
I know loads of teachers. I just thought I'd shoot a few of them a message asking about reflection in their own training and practice. Two have already proven very helpful to me in narrowing my focus and giving me a real vision of what already happens and why.
My first conversation was with an experienced secondary school teacher. (I have know him since he was 6 so calling him experienced is weird to say the least! But he has been qualified and working as a teacher for more than ten years so.....) Let's call him Ben (because that's his name!)
Ben mentors NQTs. He explained that reflection becomes second nature to effective and experienced teachers as they are always asking about how lesson plans, learning activities and individual encounters have worked. They reflect automatically on reasons things may not have been as effective as hoped, or what factors contributed to greater engagement and success than anticipated. Good teachers will seek to identify factors which impact on learning so they can be replicated or mitigated as appropriate. Ben spoke about how it is hard to avoid the process becoming a 'box ticking' exercise where facts get reported but application and evaluation are not part of the process.
My conversation with Ben crystallized to me one of the core reasons that reflection is important for teachers. It is not enough to report back on why something did or didn't work - a sober assessment of the modifiable and fixed factors which affected the event must also happen if good practice is to be replicated and mistakes not repeated.
My second conversation was with my son who has just finished a degree in primary education. He has yet to do his NQT year but obviously has done a lot of placements during his degree and reflection has been part and parcel of that. Most useful in this conversation was learning about how he and his tutor / mentor used Padlet to converse, exchange notes and keep in touch. From what he says it was an ideal tool for a two way (mentor or tutor and learner) conversation where the learner can offer reflections and the mentor can guide them in becoming more effective in it.
My reading around the subject has led me to the 'acculturation' which I feel is key. What the NQT year aims to do is change trained individuals from students into practitioners. They must develop a new mindset so that they can operate as fully independent teachers at the end of the year. Becoming fully acculturated involves moving from 'reflective practice' being a mandatory part of the curriculum to being an automatic, intuitive and natural part of daily practice. It would be great if the tool we develop could enable that.
I cannot express how much better I feel having had a web conference with 5 our of 6 of our team at the weekend. Making decisions is easy when someone suggests something eminently sensible and everyone just agrees! In a forum setting people seem a little more tentative in making suggestions for fear of being forceful (I assume) but some decisions simply need to be made.
As we are inventing our context as well as our platform, pedagogy and learning design we are in an unusual situation.Most learning design is created by people for a context which they have been presented with - not one they've invented. Most pedagogy and platform debates are framed by the platform that is available and the pedagogical values in place rather than inventing it all from nothing.
This openness can be exciting but also daunting. It's oddly easier to create a meal from a set of ingredients than to scour reciple books, go shopping and then cook, Too many options slow the process.
Because of that it's such a relief when someone says 'so... medics or teachers?' and someone else says 'I'd prefer teachers' and everyone goes 'fine' because most of us have no preference but don't want to step on the toes of those who do. And then, when that is decided, we get a bit of homework so that we can have a further discussion in a few days.
And in the meantime I am doing stuff. Nothing massive but peripheral and potentially useful things. Reading papers, extracting relevant quotes and writing a brief precis followed by my own take on it. I have added some stuff to the website - nothing expect to make the final cut necessarily but scaffolding on which more can be done. It's hard to work on things which I know to be peripheral but a well rounded project needs the periphery. And foundational efforts make the rest of the work stronger and more secure.
RULE 3: Just do something
One of our seven team members has not showed up at all yet. He is in Bangladesh so it's not as if we an pop around to see if he is OK!
Another team member is still snowed under by the last TMA. He will be up and ready to join in when he's submitted it in a few days time but so far his input has been sporadic.
A third team member lives in Dominica so is many hours behind the rest of us. When we work in the evening he is still at work, when he works in the evening we are tucked up in bed!
A fourth member is struggling a bit with the technology. Her computer struggles with all the apps we are trying to use to collaborate best.
A fifth member is impressively taking the lead on a lot of things and has been unanimously elected team leader. My fear is that it would be all too easy to let her get on with it unsupported.
And then there is me. I am enjoying the collaboration a lot more than I expected to. Now some clearly defined tasks and goals are emerging from the vague gloom that is the spec I can envisage a final project.
The thing is that collaboration carries so many risks. Non-engagement is obvious. 'Over engagement' can look great as it gets stuff done but it can allow people to get an easy ride when a competent team member simply does it all. Busy-ness can sound like an excuse but for our team - all of us a juggling work and other commitments with our studies. We know that the best of intentions aside - life simply happens sometimes and our time and energy must be directed elsewhere. Technological failure is part and parcel of everyday life! The downside of the hyper convenient technologically enhanced lifestyles we now enjoy is that success or failure feels like it hangs on our internet connection speed!
RULE 2: Everyone on the team has their own challenges and circumstances. We all need to be willing to take up some slack, and sometimes acknowledge that we've dropped a few balls. That's team work.
This blog might contain posts that are only visible to logged-in users, or where only logged-in users can comment. If you have an account on the system, please log in for full access.